Facebook
 X
X
 Pinterest
 Copy Link


Do I need a permit to build an ADU?
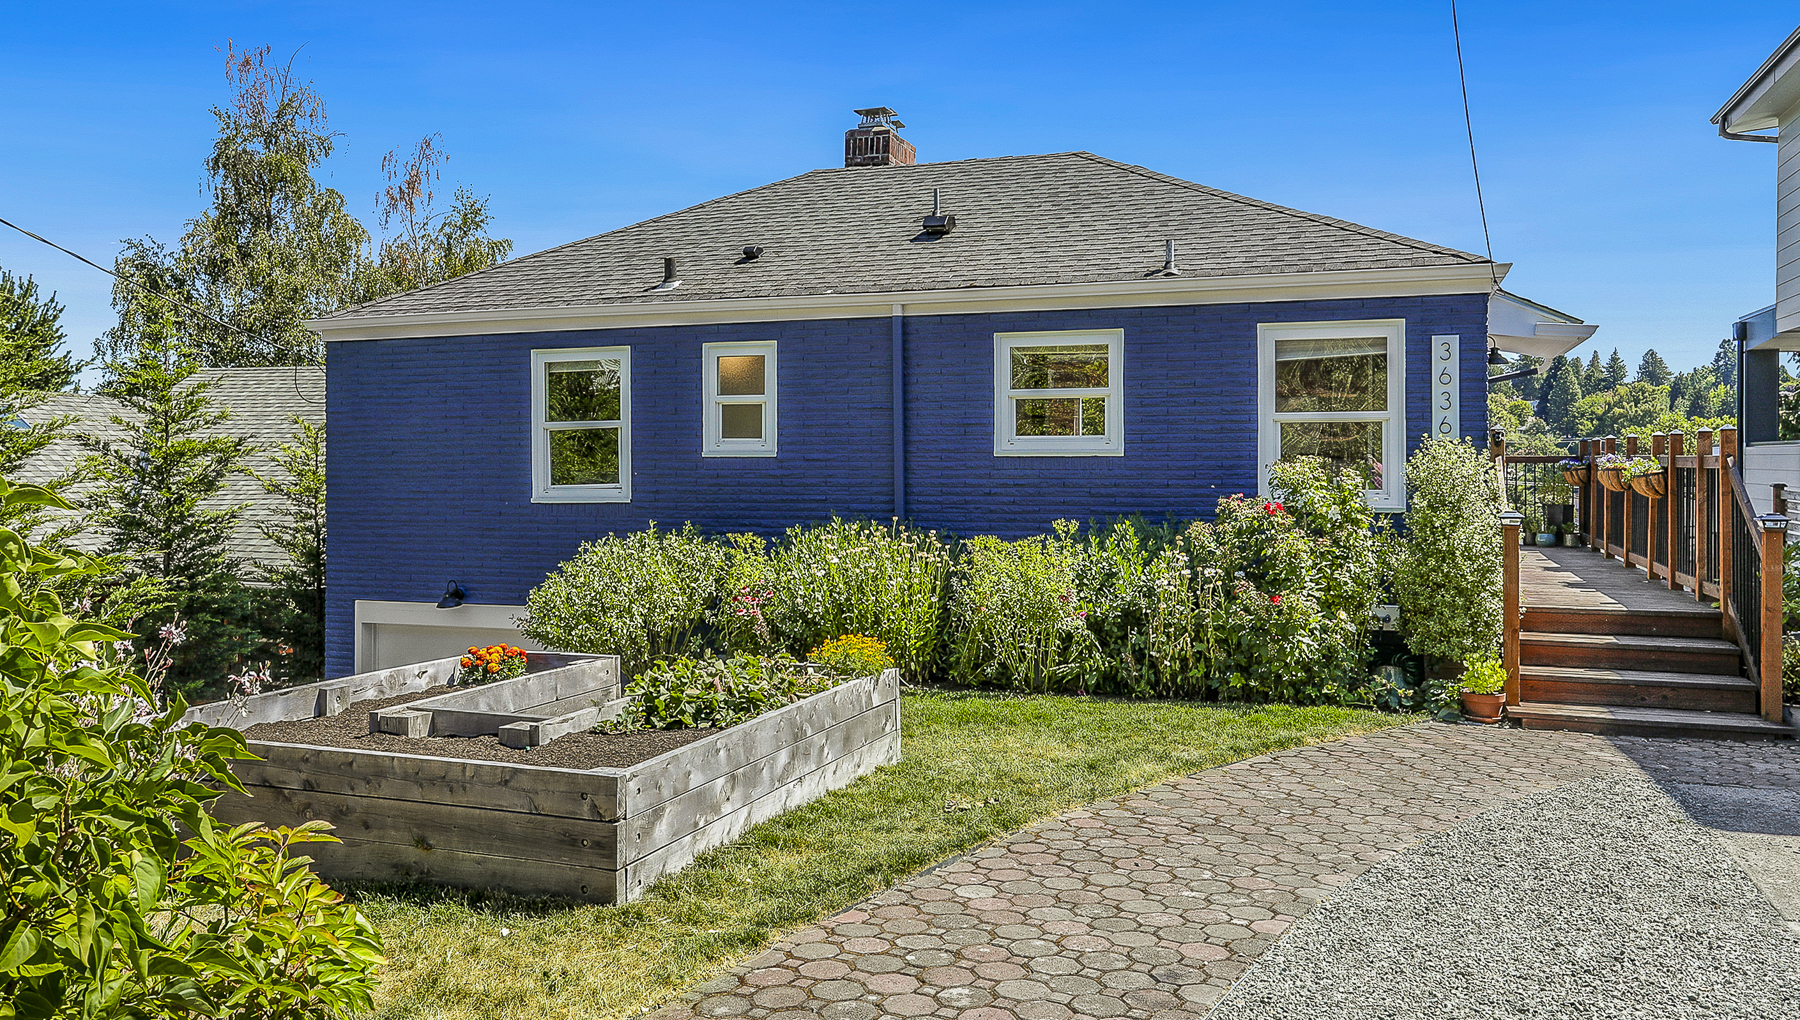
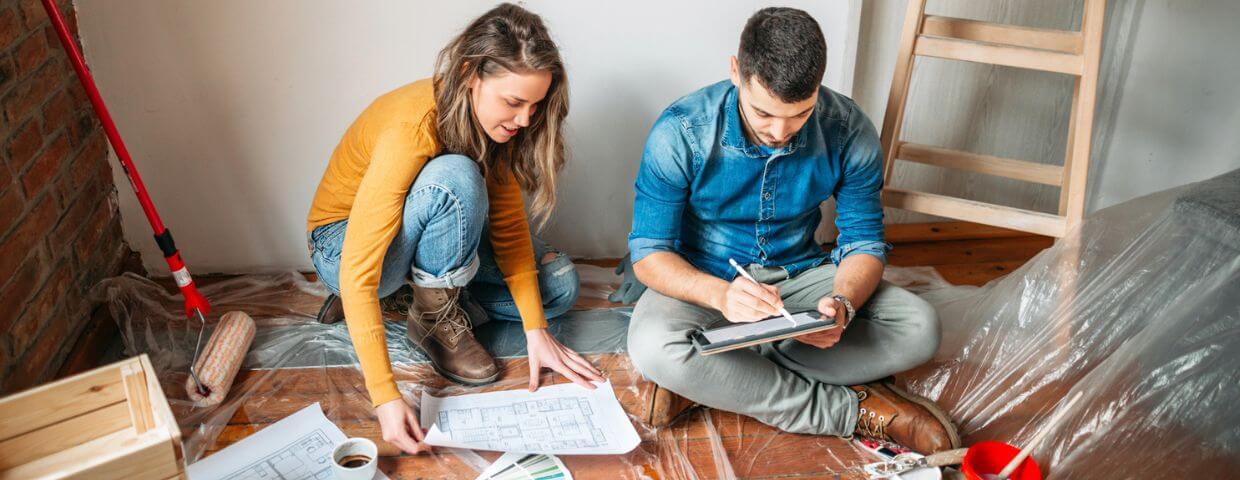
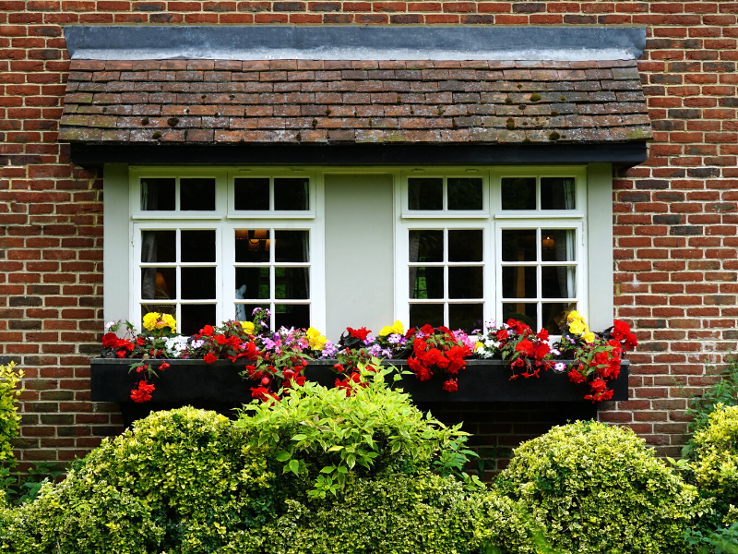
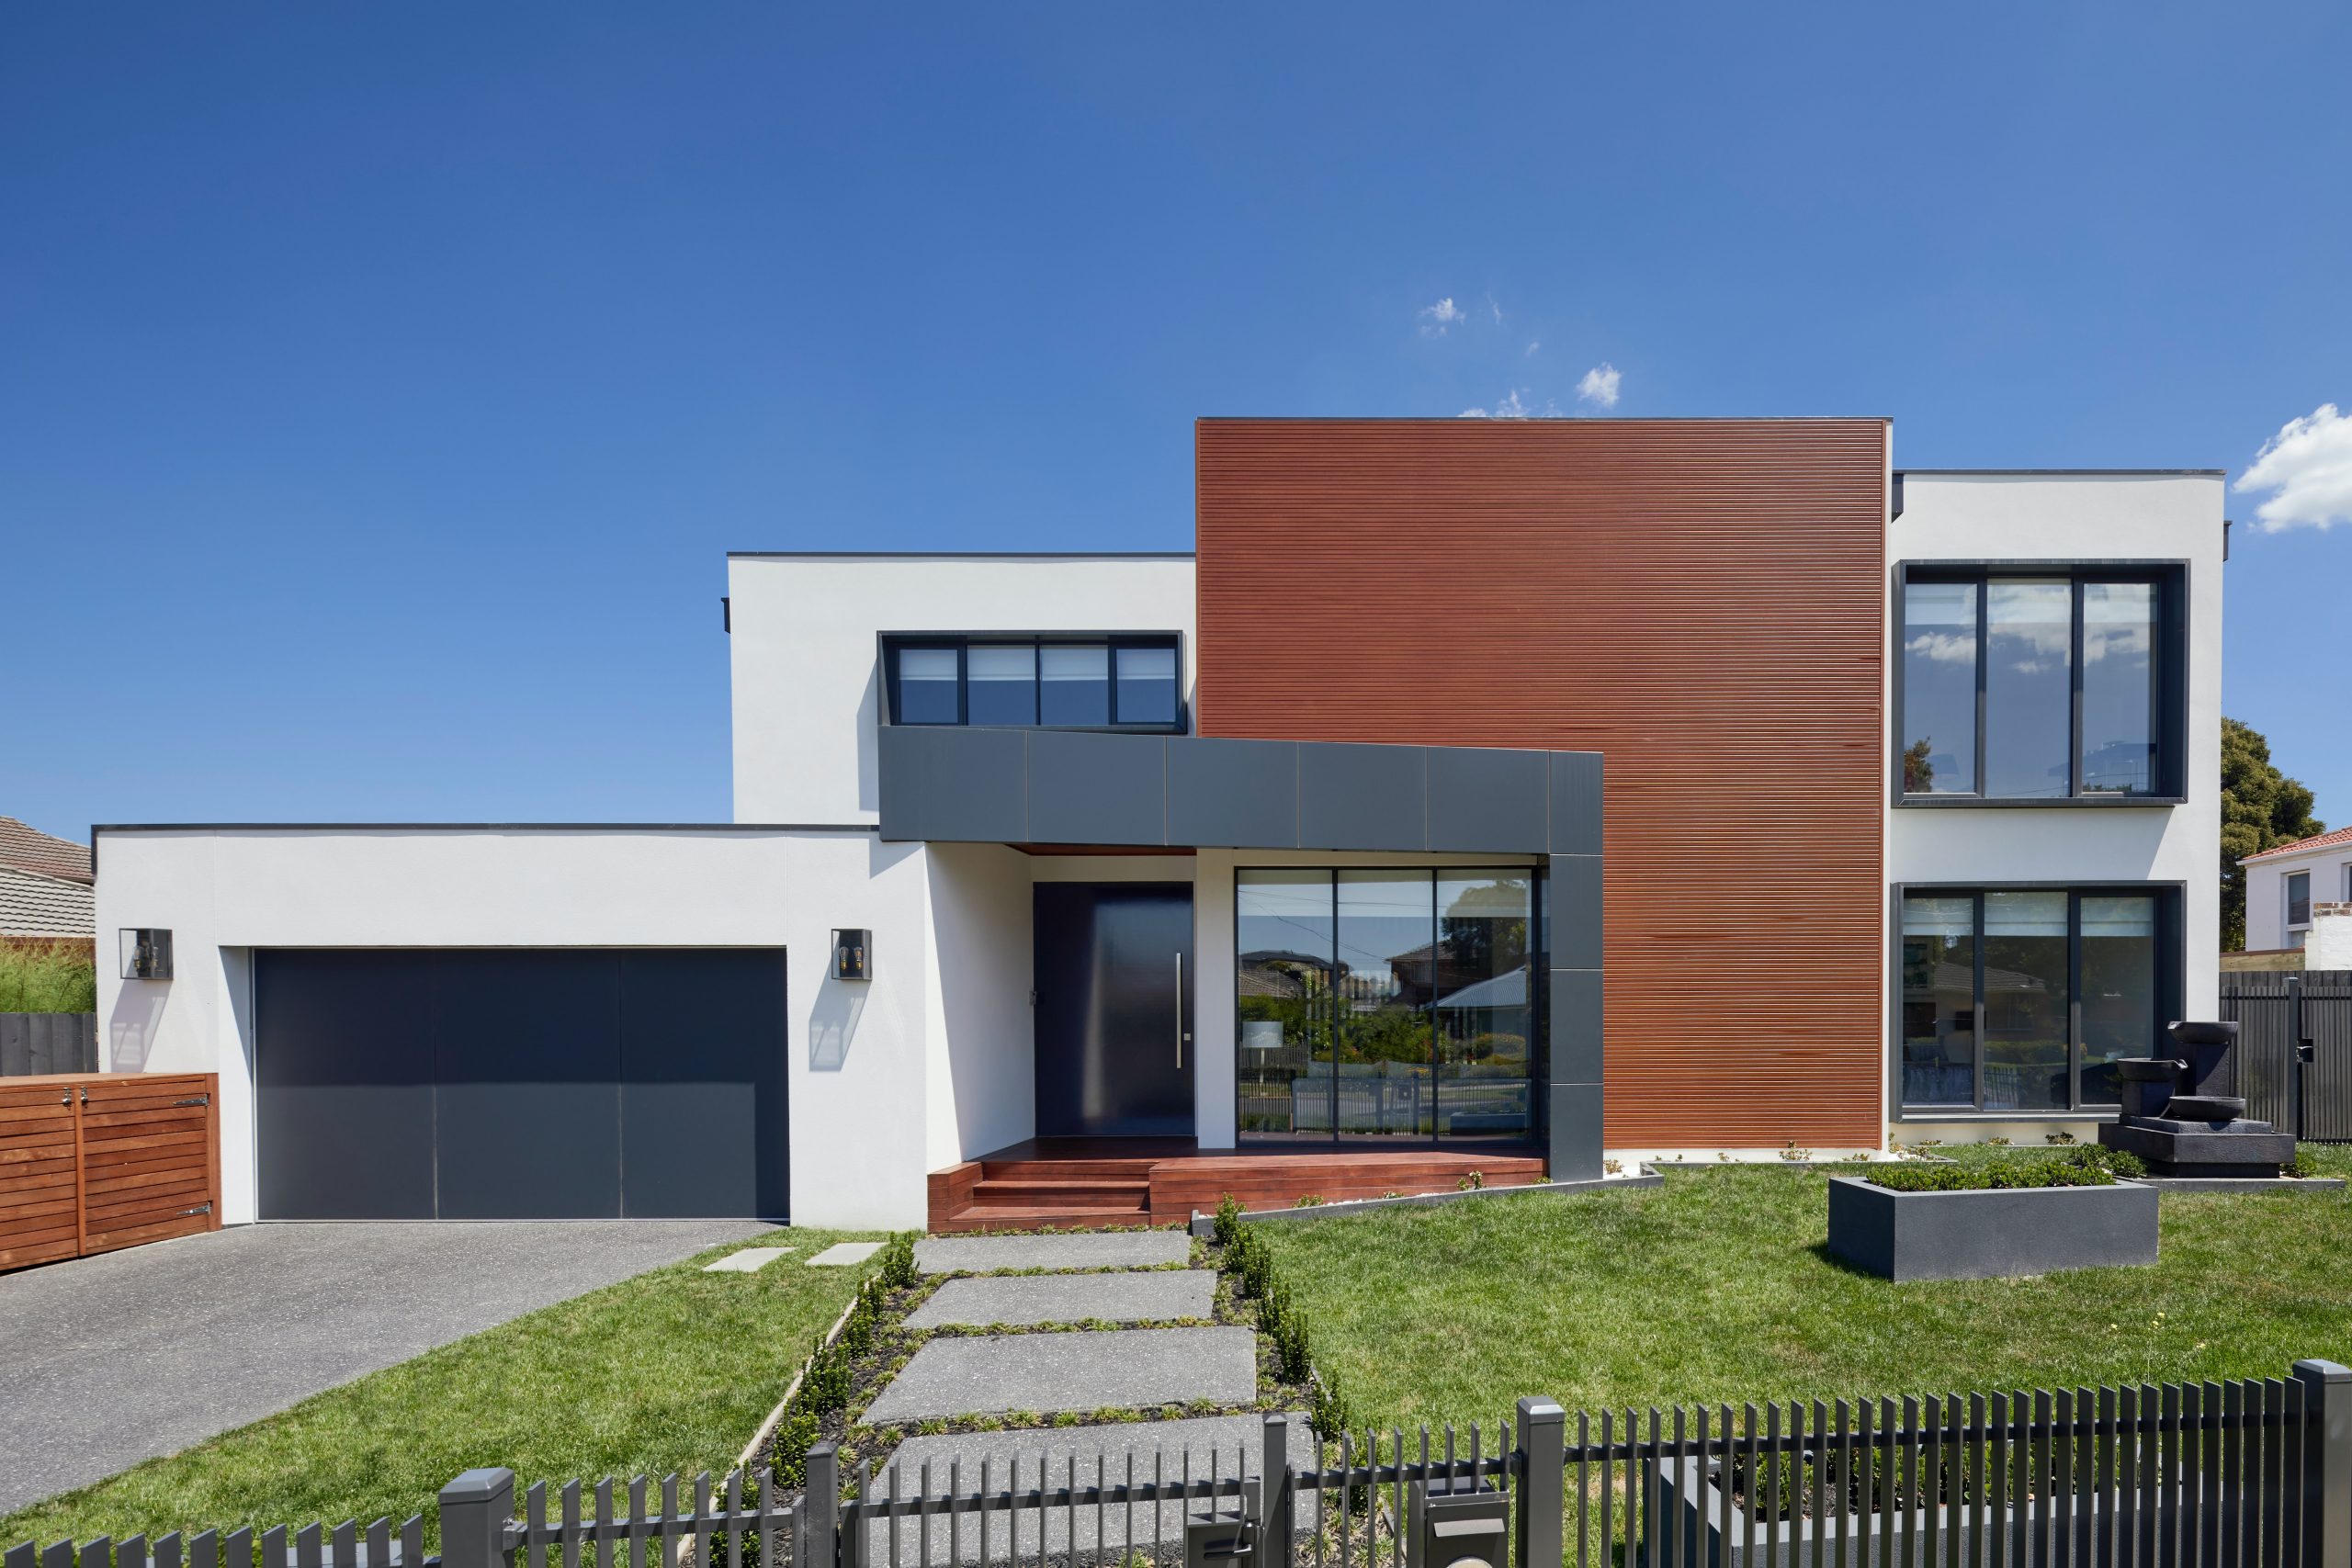
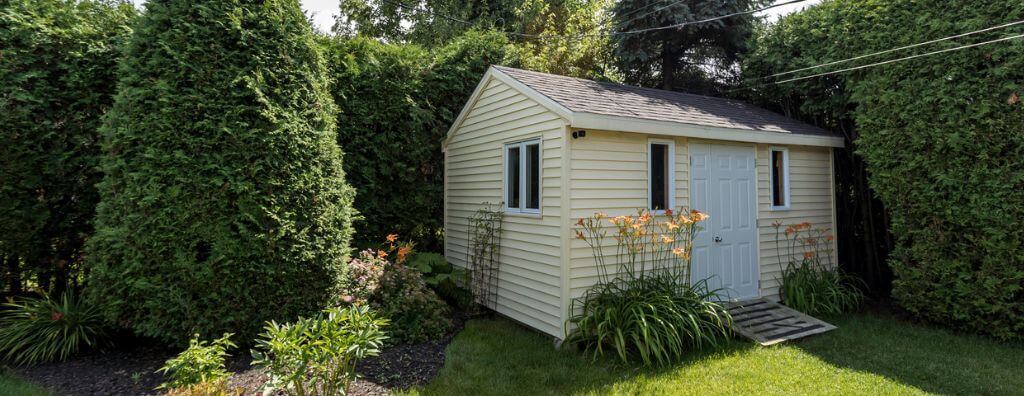
Accessory Dwelling Units (ADUs) and other additional property structures have emerged as viable options for homeowners looking to maximize their property’s potential. These structures offer additional living space while creating opportunities to generate extra income or accommodate multigenerational family members. But before you break ground on your building project, here are some of the things you should keep in mind.
- Permits and Regulations: No matter where you live, it is necessary to obtain the appropriate permit before you begin the construction process. Permits ensure that your project complies with local building codes and regulations. Though some guidelines are universal, keep in mind that every local area has its own specific building requirements for residential properties.
- Code Compliance: Building codes aren’t just red tape for the sake of red tape; they exist to make sure that all buildings are safe. Whether you’re building the structures on your property DIY or hiring a professional to do the job, you are the one kickstarting the project, not your local municipality. But by having these codes in place, they can ensure that you’re adhering to the required standards of safety. Before you even start on your project, familiarize yourself with your local codes and regulations. Contact your local zoning department or building authority to learn more.
- Applying for a Permit: The permit application process varies by location. Typically, you’re required to submit detailed plans for your project with documents that outline its scope, size, etc. Whether you submit architectural drawings, engineering plans, or some other form of detailed blueprint, be prepared for a thorough review on behalf of your local authority to make sure your project complies with the rules.
Whatever project you have in mind—ADU, garden shed, pool house—it’s important to become well-versed in the permits and regulations that will allow you to get it built hassle-free. Consult with local authorities to get the full picture of what’s required from you. Once you’ve checked all the boxes, you’ll be well on your way to maximizing the value of your property. Pair your building project with these design ideas to take your backyard to the next level: