The following analysis of select counties of the Western Washington real estate market is provided by Windermere Real Estate Chief Economist Matthew Gardner. We hope that this information may assist you with making better-informed real estate decisions. For further information about the housing market in your area, please don’t hesitate to contact your Windermere Real Estate agent.
Regional Economic Overview
Although the job market in Western Washington continues to grow, the pace has started to slow. The region added over 91,000 new jobs during the past year, but the 12-month growth rate is now below 100,000, a level we have not seen since the start of the post-COVID job recovery. That said, all but three counties have recovered completely from their pandemic job losses and total regional employment is up more than 52,000 jobs. The regional unemployment rate in November was 3.8%, which was marginally above the 3.7% level of a year ago. Many business owners across the country are pondering whether we are likely to enter a recession this year. As a result, it’s very possible that they will start to slow their expansion in anticipation of an economic contraction.
Western Washington Home Sales
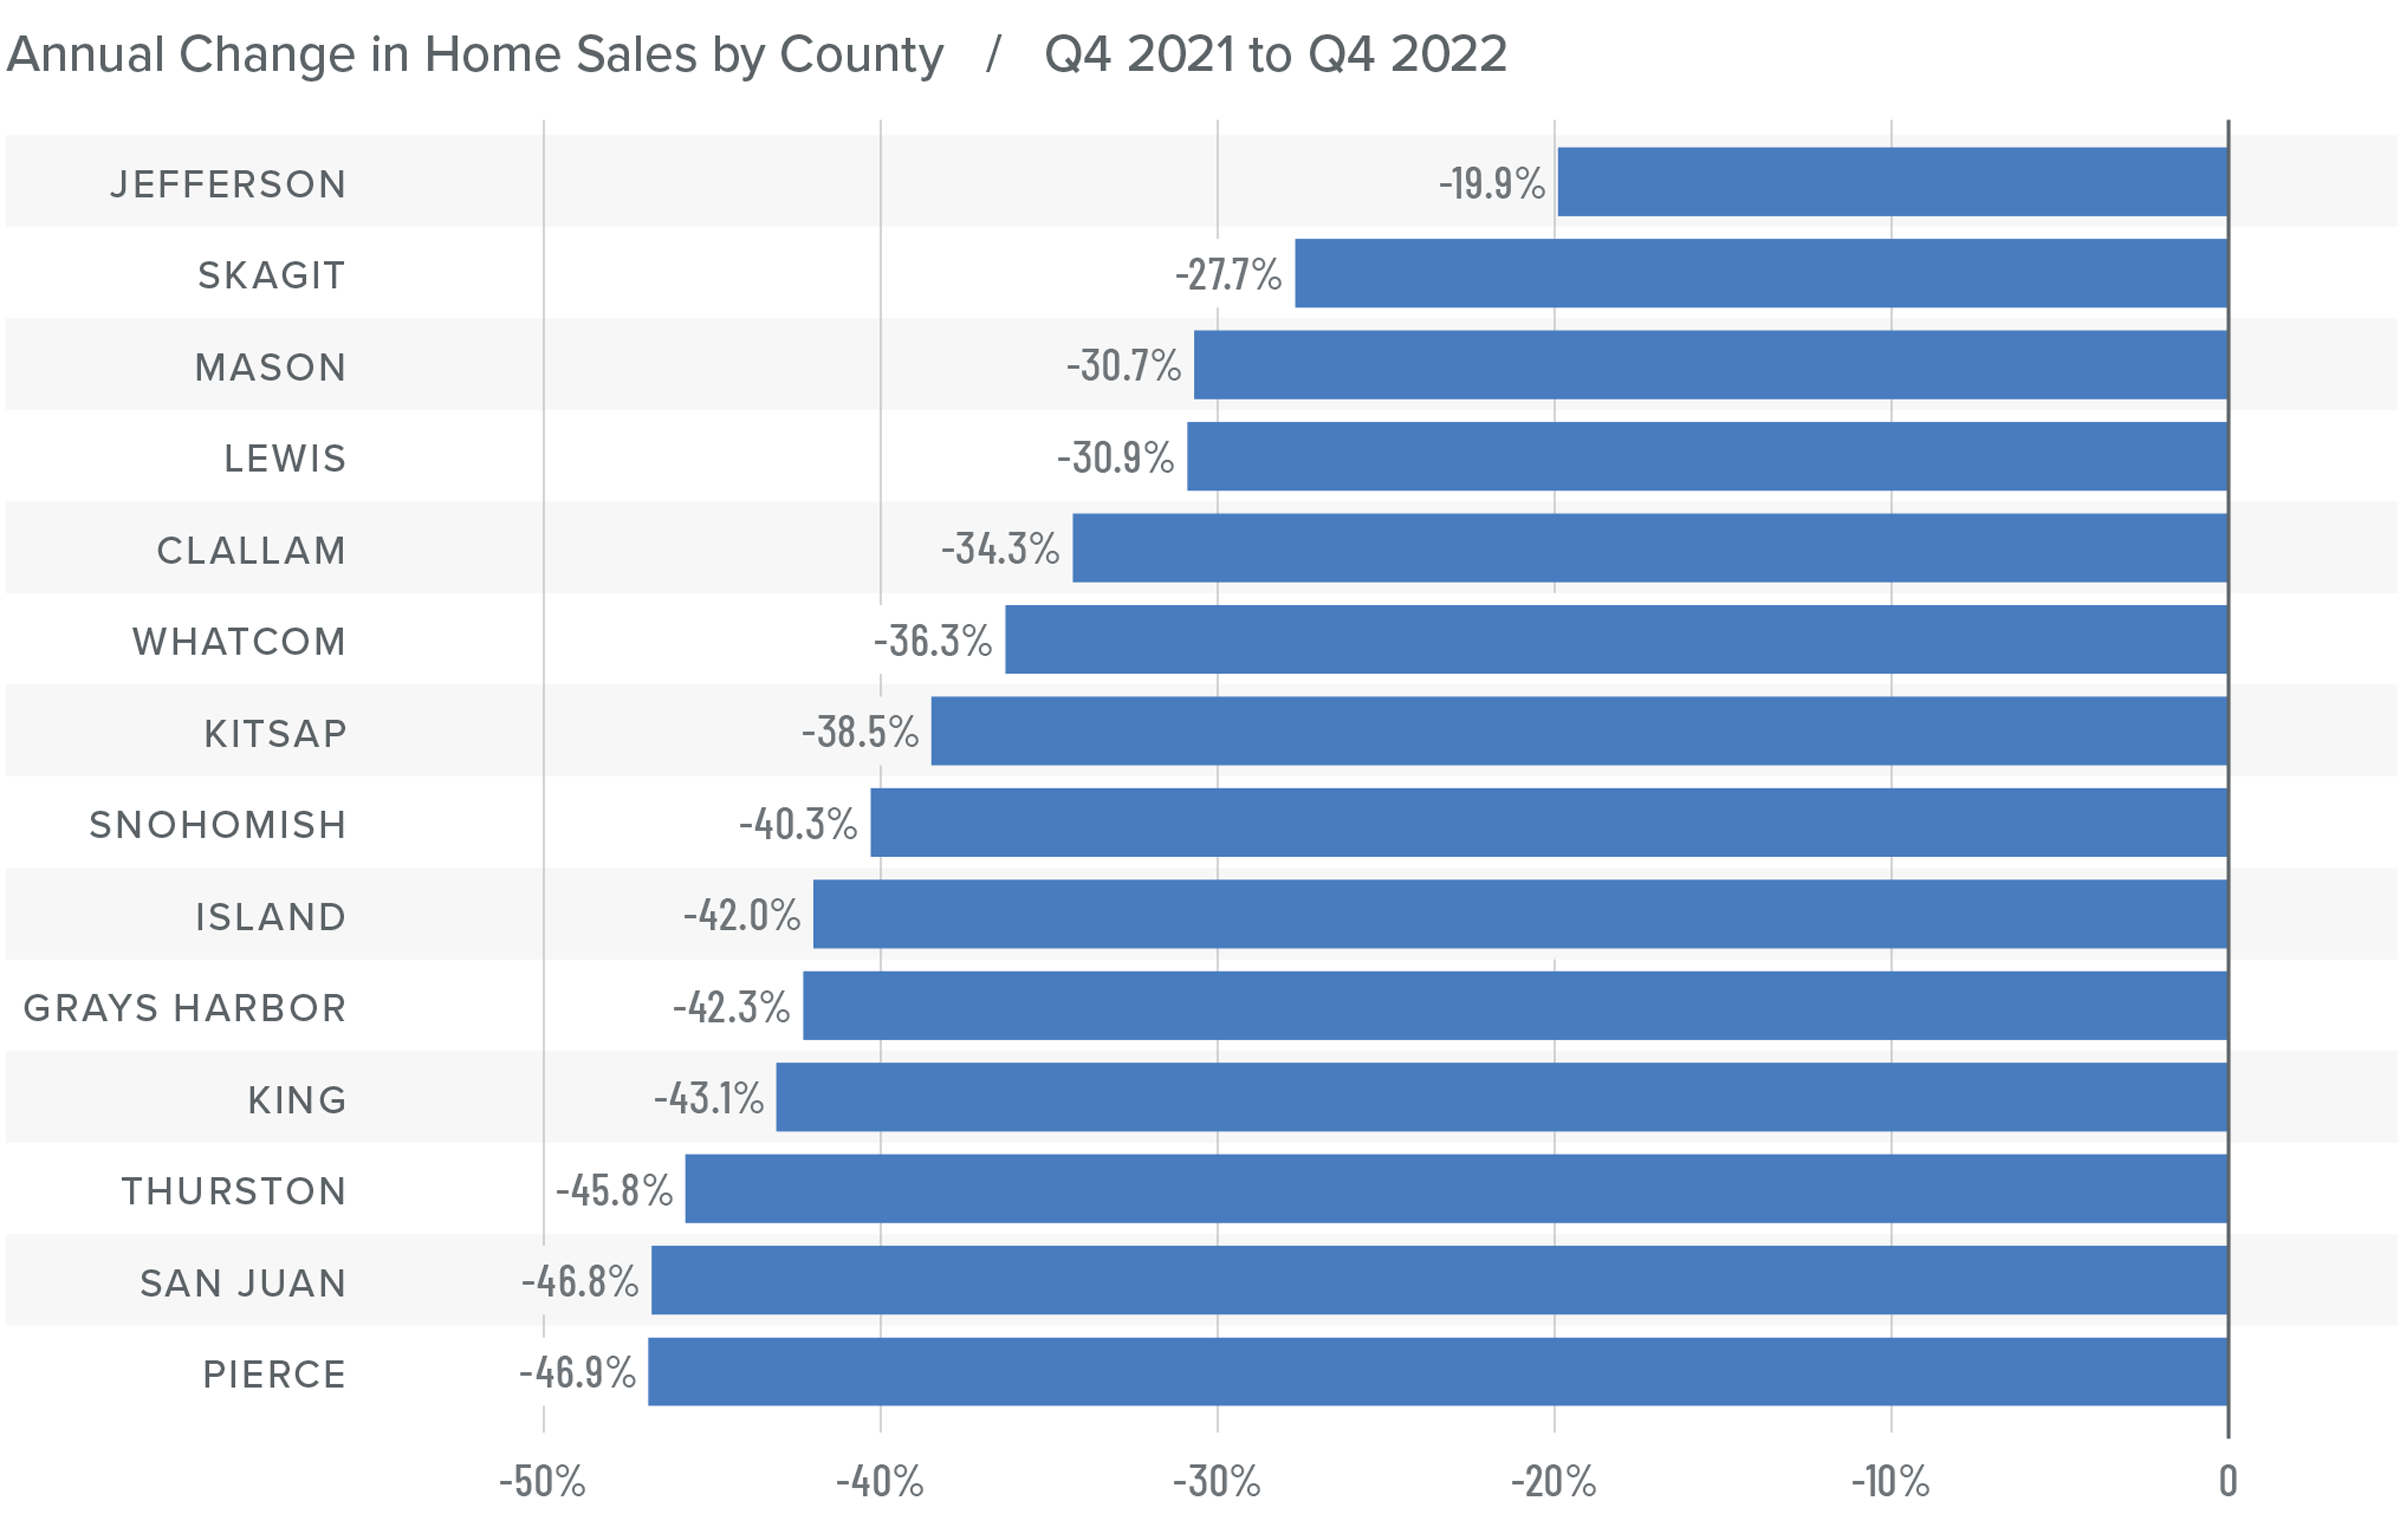
❱ In the final quarter of 2022, 12,711 homes sold, representing a drop of 42% from the same period in 2021. Sales were 34.7% lower than in the third quarter of 2022.
❱ Listing activity rose in every market year over year but fell more than 26% compared to the third quarter, which is expected given the time of year.
❱ Home sales fell across the board relative to the fourth quarter of 2021 and the third quarter of 2022.
❱ Pending sales (demand) outpaced listings (supply) by a factor of 1:2. This was down from 1:6 in the third quarter. That ratio has been trending lower for the past year, which suggests that buyers are being more cautious and may be waiting for mortgage rates to drop.
Western Washington Home Prices
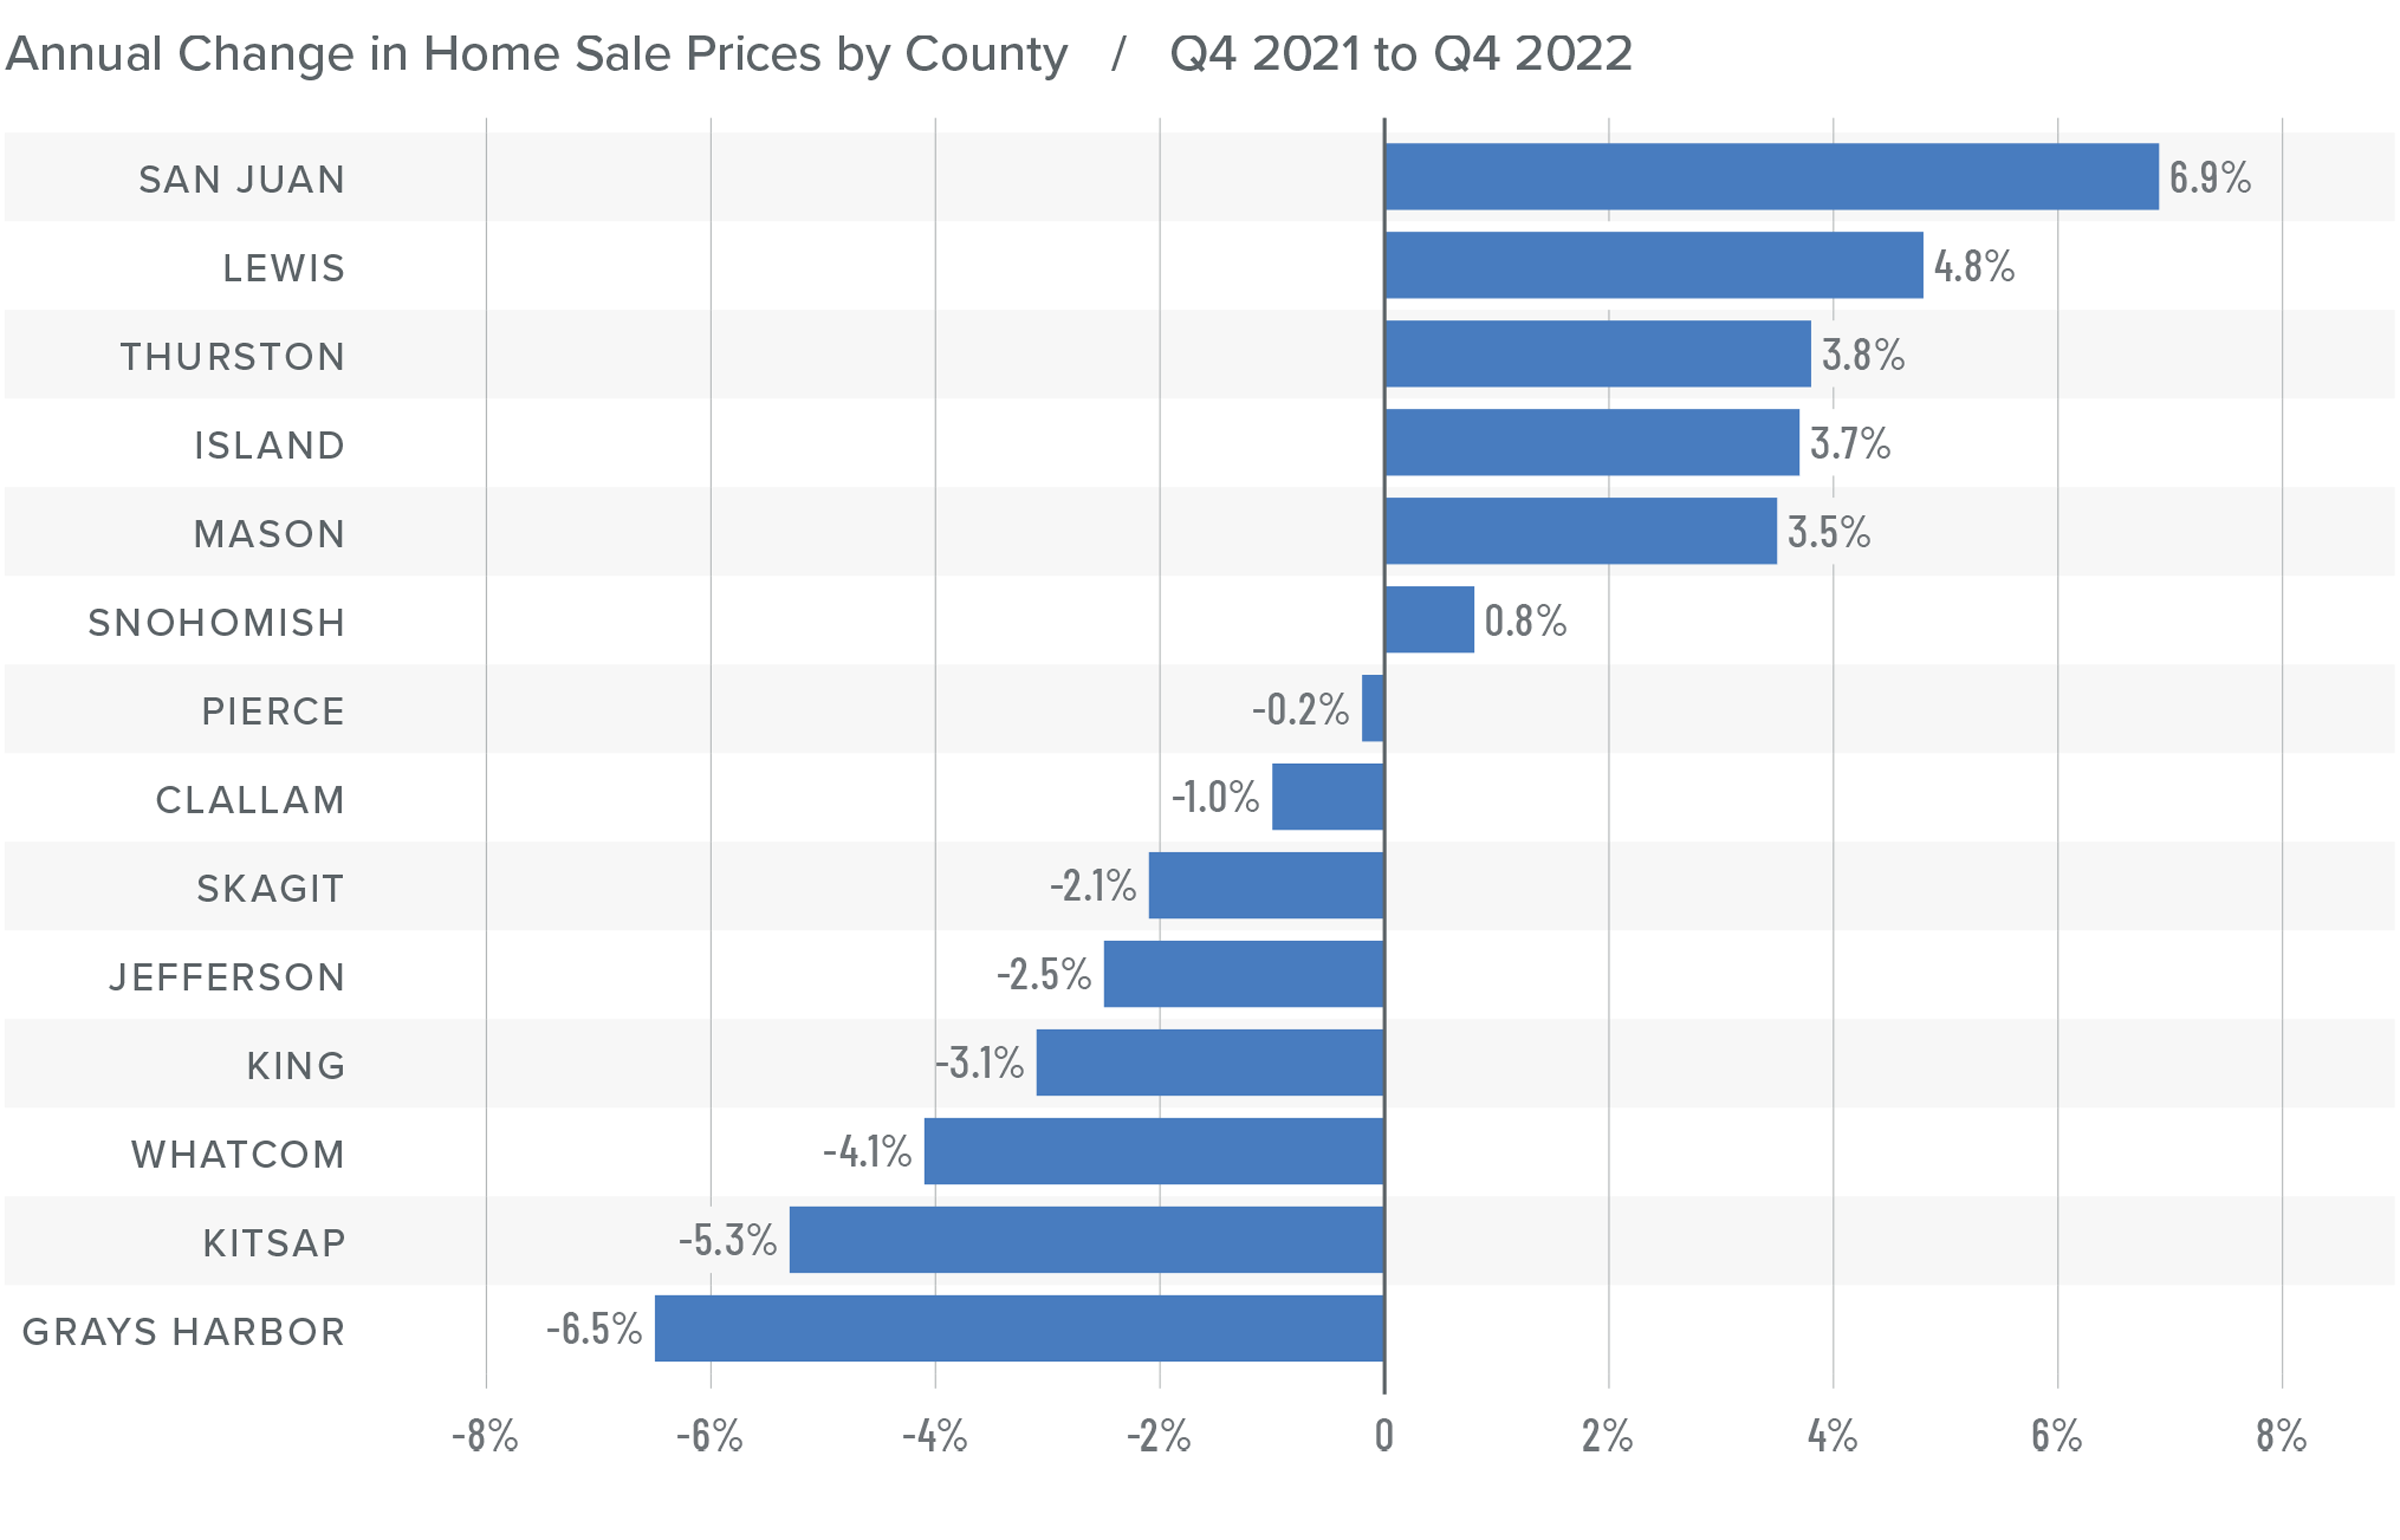
❱ Sale prices fell an average of 2% compared to the same period the year prior and were 6.1% lower than in the third quarter of 2022. The average sale price was $702,653.
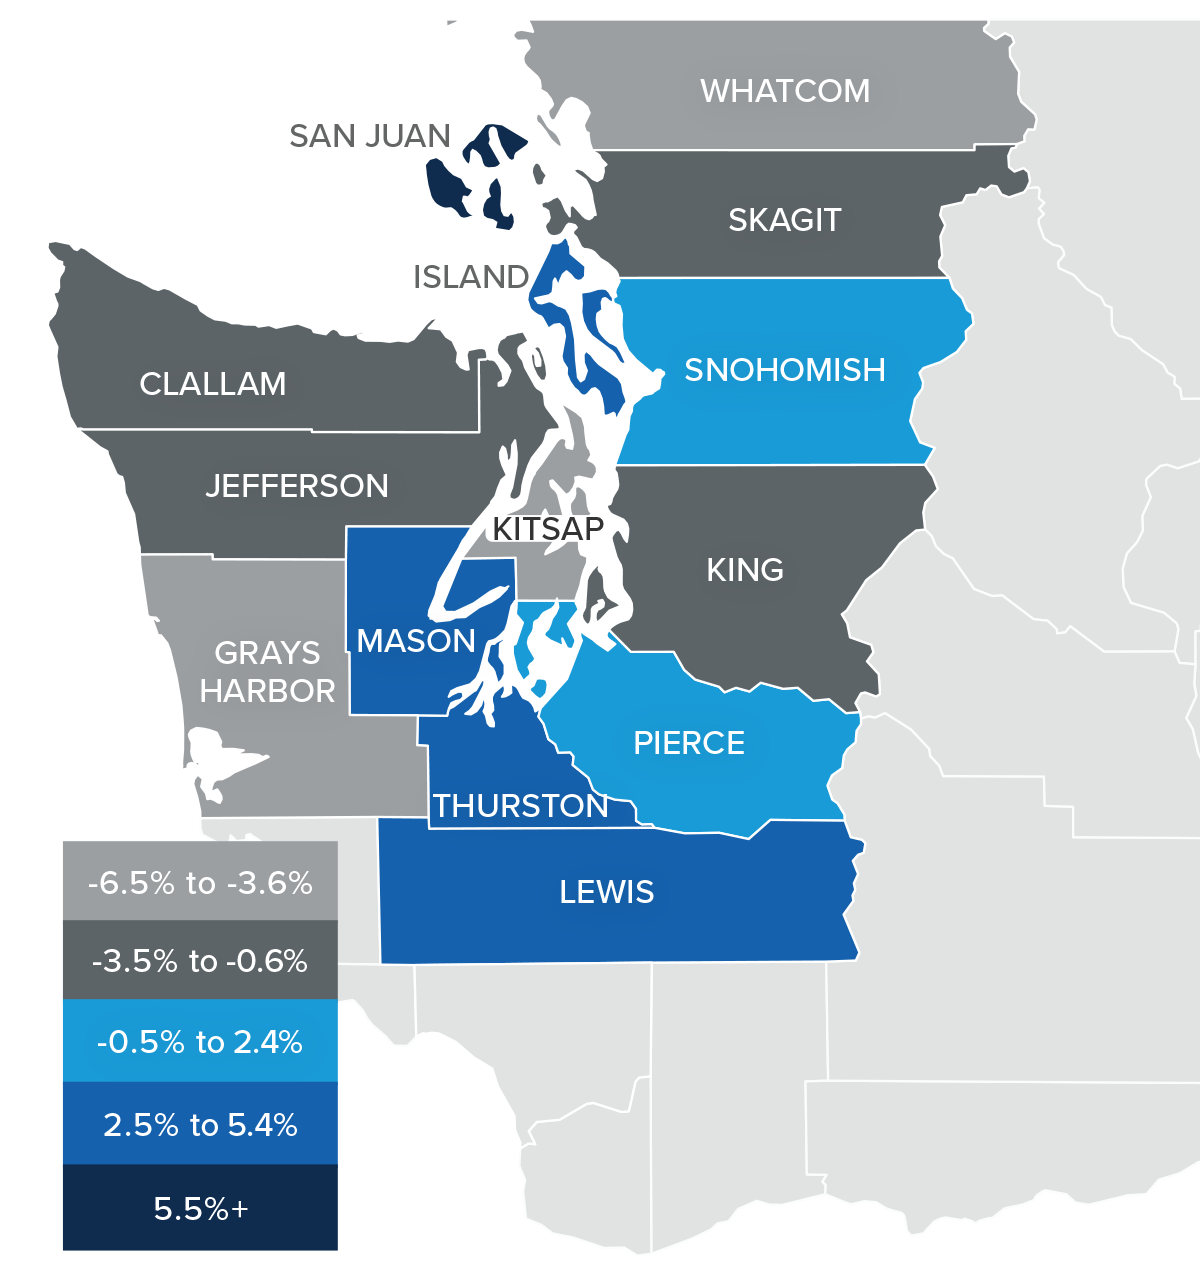
❱ The median listing price in the fourth quarter of 2022 was 5% lower than in the third quarter. Only Skagit County experienced higher asking prices. Clearly, sellers are starting to be more realistic about the shift in the market.
❱ Even though the region saw aggregate prices fall, prices rose in six counties year over year.
❱ Much will be said about the drop in prices, but I am not overly concerned. Like most of the country, the Western Washington market went through a period of artificially low borrowing costs, which caused home values to soar. But now prices are trending back to more normalized levels, which I believe is a good thing.
Mortgage Rates
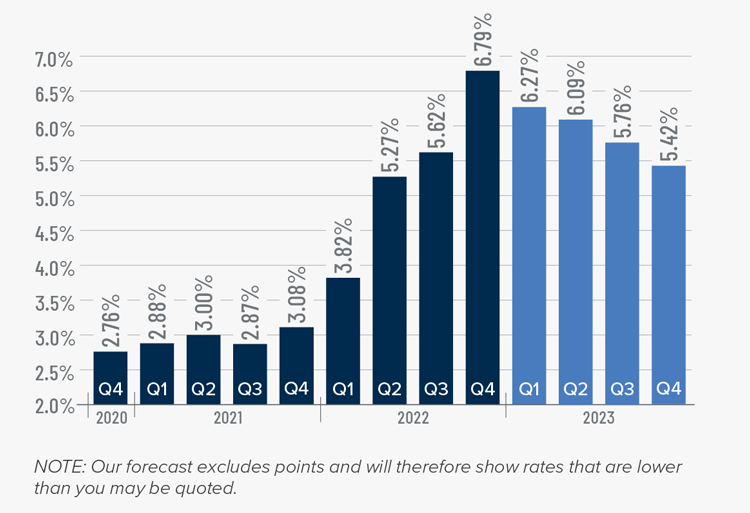
Rates rose dramatically in 2022, but I believe that they have now peaked. Mortgage rates are primarily based on the prices and yields of bonds, and while bonds take cues from several places, they are always impacted by inflation and the economy at large. If inflation continues to fall, as I expect it will, rates will continue to drop.
My current forecast is that mortgage rates will trend lower as we move through the year. While this may be good news for home buyers, rates will still be higher than they have become accustomed to. Even as the cost of borrowing falls, home prices in expensive markets such as Western Washington will probably fall a bit more to compensate for rates that will likely hold above 6% until early summer.
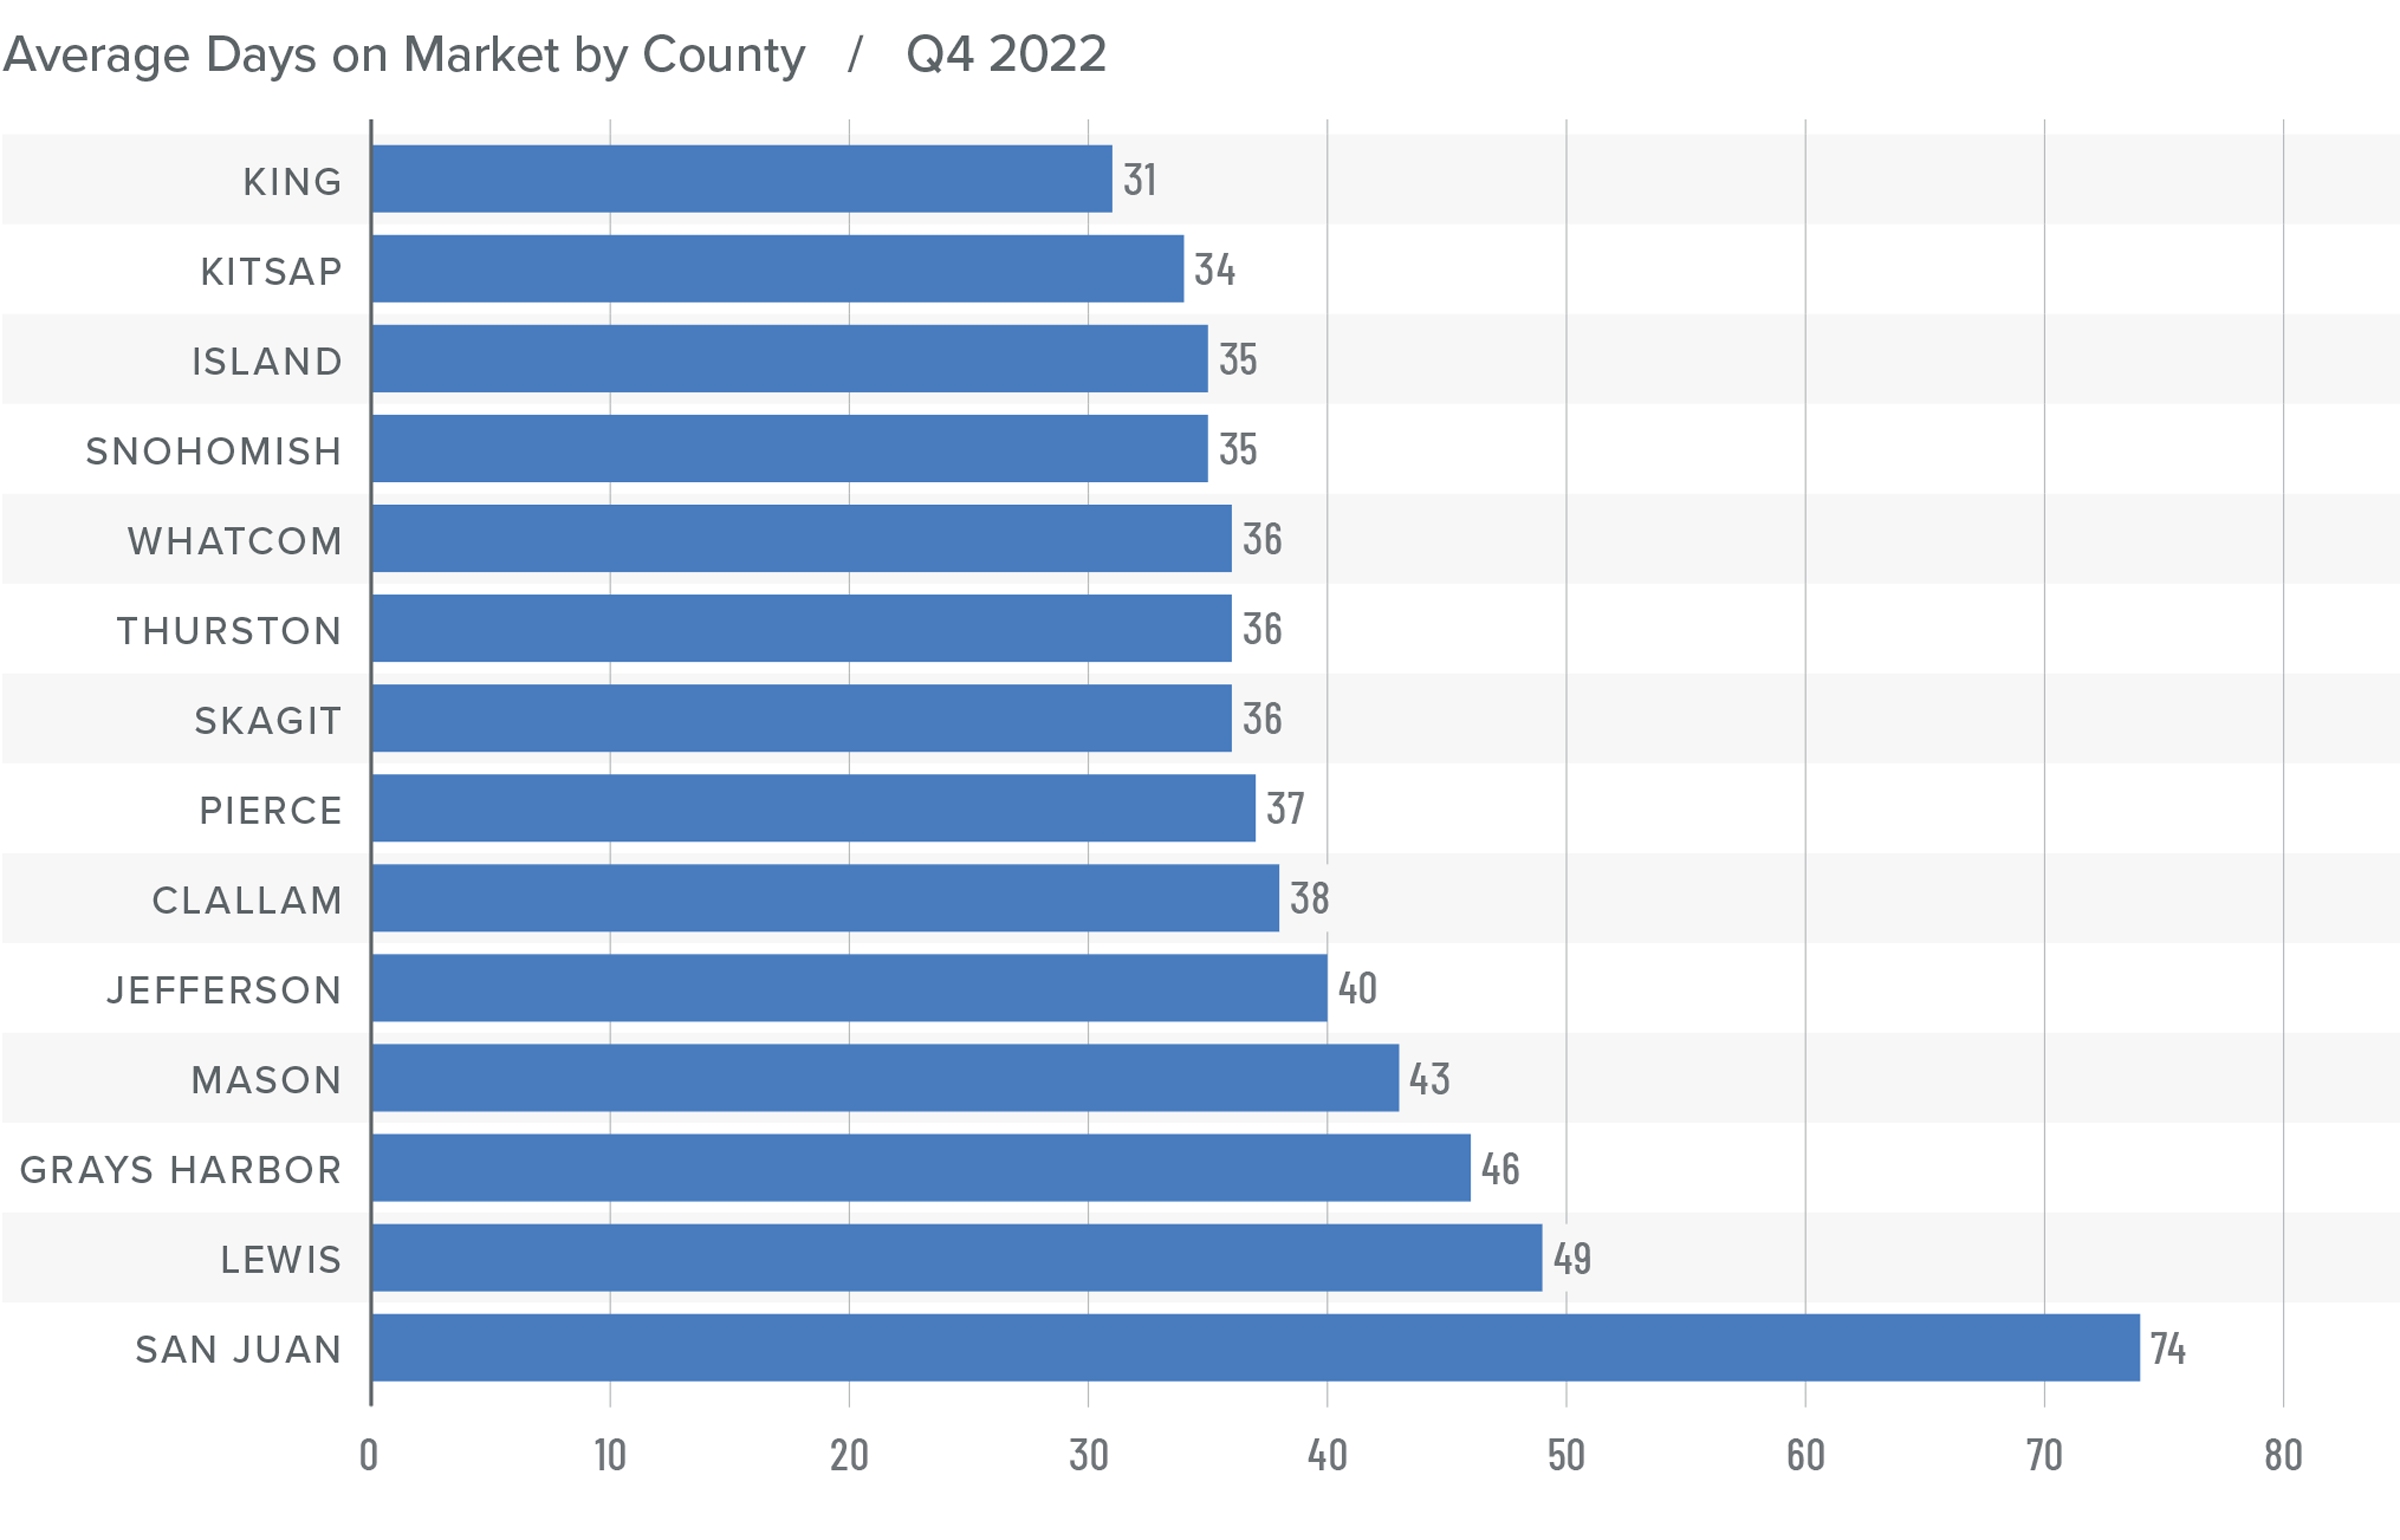
Western Washington Days on Market
❱ It took an average of 41 days for homes to sell in the fourth quarter of 2022. This was 17 more days than in the same quarter of 2021, and 16 days more than in the third quarter of 2022.
❱ King County was again the tightest market in Western Washington, with homes taking an average of 31 days to find a buyer.
❱ All counties contained in this report saw the average time on market rise from the same period a year ago.
❱ Year over year, the greatest increase in market time was Snohomish County, where it took an average of 23 more days to find a buyer. Compared to the third quarter of 2022, San Juan County saw average market time rise the most (from 34 to 74 days).
Conclusions
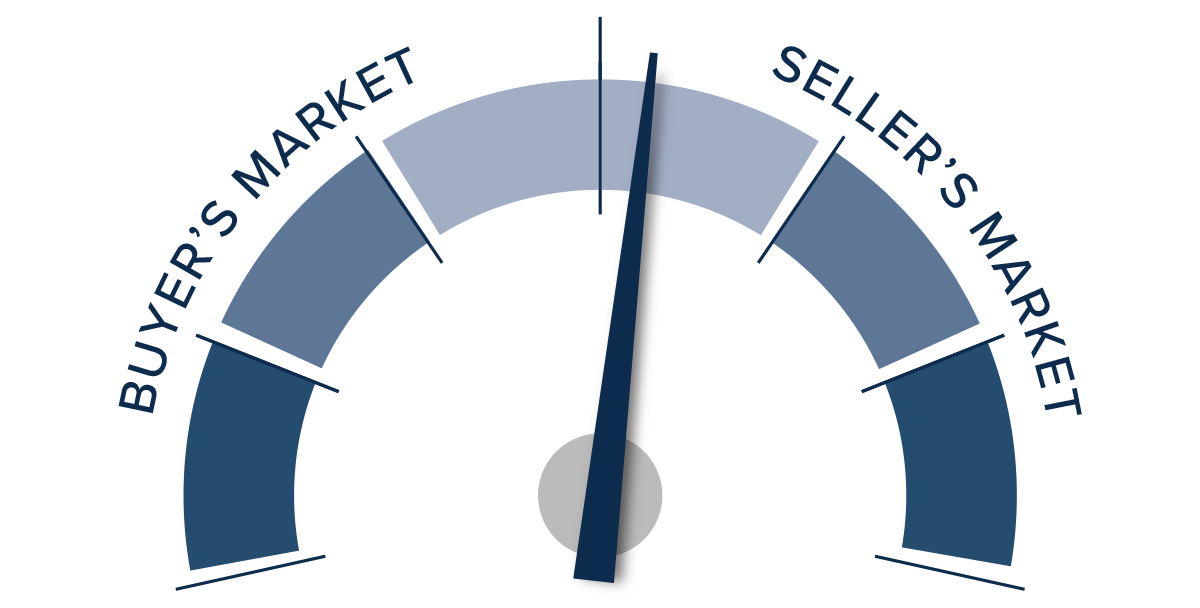
This speedometer reflects the state of the region’s real estate market using housing inventory, price gains, home sales, interest rates, and larger economic factors.
The regional economy is still growing, but it is showing signs of slowing. Although this is not an immediate concern, if employees start to worry about job security, they may decide to wait before making the decision to buy or sell a home. As we move through the spring I believe the market will be fairly soft, but I would caution buyers who think conditions are completely shifting in their direction. Due to the large number of homeowners who have a mortgage at 3% or lower, I simply don’t believe the market will become oversupplied with inventory, which will keep home values from dropping too significantly.
Ultimately, however, the market will benefit buyers more than sellers, at least for the time being. As such, I have moved the needle as close to the balance line as we have seen in a very long time.
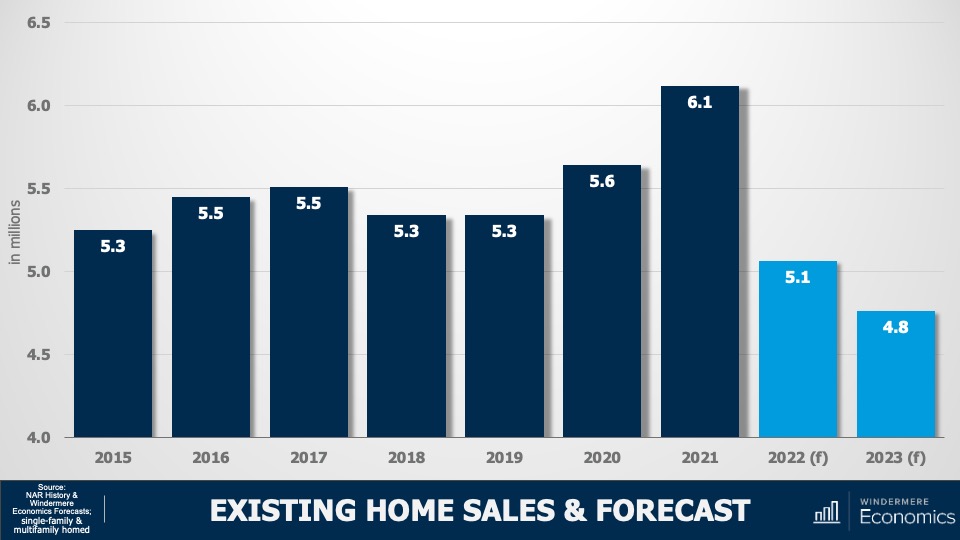
U.S. home sales trended lower through all of 2022 and, although I believe that sales will still have held above five million, this certainly won’t be the case in 2023. Affordability and higher financing costs will continue to act as headwinds when it comes to sales, but I think that the bigger issue will be that listing activity will not rise significantly as we move through the year.
As I have been saying for several months now, I don’t see why many households who don’t have to move will move and lose the historically low interest rate that they currently benefit from. That said, sales will still occur this year but at just 4.8 million, sales will be lower than we have seen since 2014.
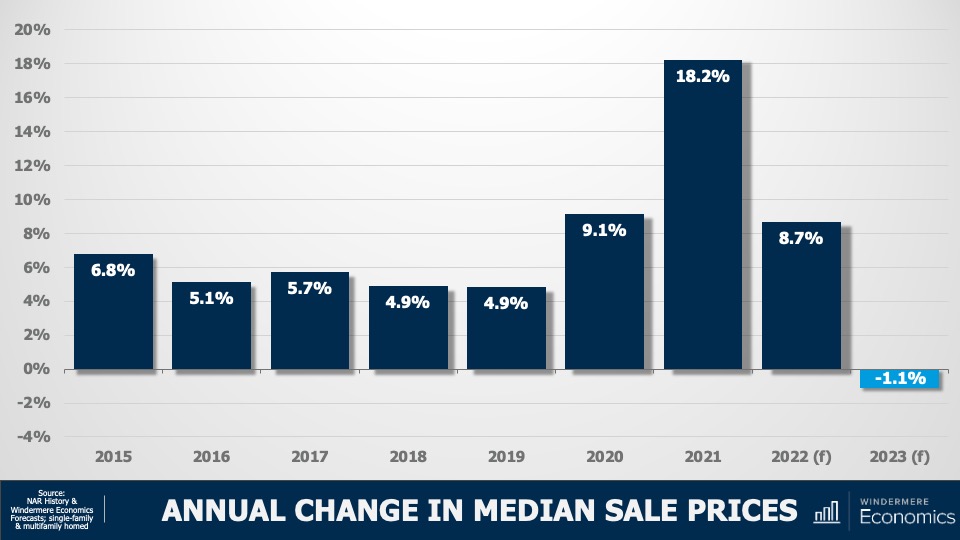
Annual Change in Median Sale Prices
Image Source: Matthew Gardner
Much has been said about the future of home prices, with some forecasters even suggesting that housing prices will collapse in a similar fashion to that seen following the bursting of the housing bubble back in 2008. Now, although price growth through the pandemic period was clearly excessive, fundamentally speaking, the two periods cannot be considered to be similar at all.
It’s my opinion that sale prices in 2023 will be very modestly lower than last year and I certainly don’t expect to see a collapse in home values.
But not all markets are created equal. The pandemic created what has become known as “Zoom-Towns.” These were cheap markets that affluent buyers flocked to because of their newly found ability to work from home and this led sale prices there to soar. It’s these locations that will likely see prices fall more significantly. Ultimately, expect to see prices fall through the first half of this year before starting to recover in the second half.
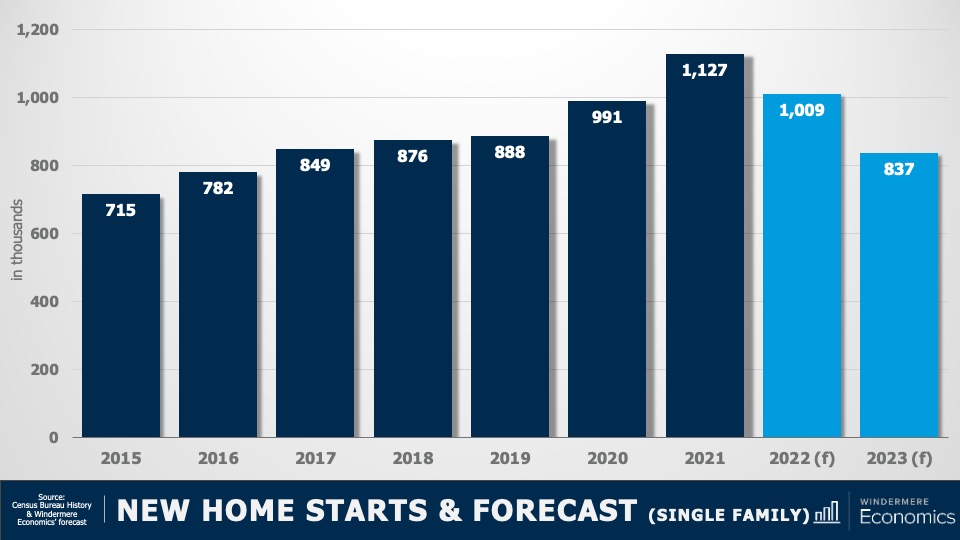
New Home Starts & Forecast (Single Family)
Image Source: Matthew Gardner
Looking now at the new construction market, housing starts fell last year as construction costs remained high and mortgage rates rose which lowered demand. And I’m afraid that I do not see 2023 as being one where builders will deliver more inventory, with starts pulling back to a level the country hasn’t seen since 2016. That said, I am expecting a recovery in 2024 when new home starts will break back above the 1,000,000 level.
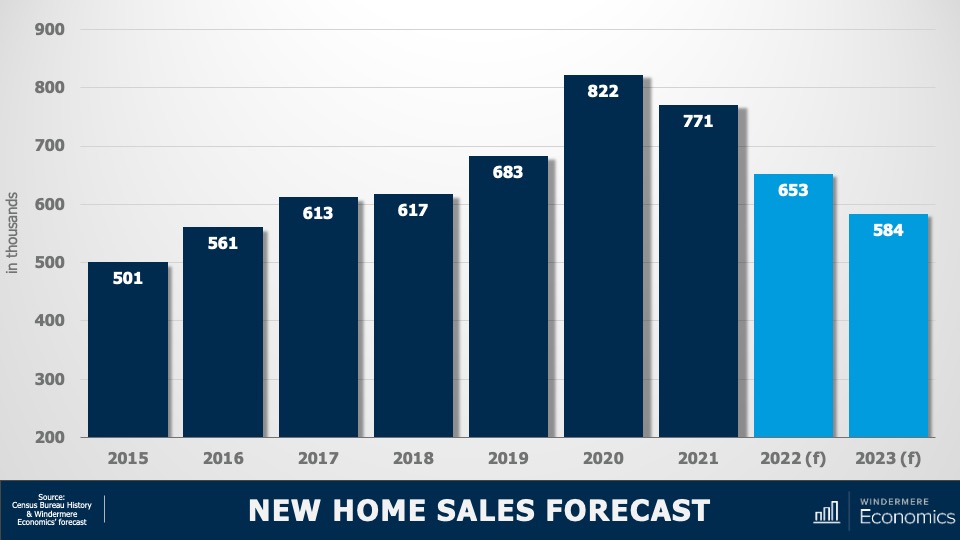
New Home Sales Forecast
Image Source: Matthew Gardner
New home sales in 2023 will fall further coming in below 600,000 but there is some light at the end of the tunnel with sales picking up fairly significantly again in 2024. We all understand that the country has a significant undersupply of ownership housing, but the costs associated with building new homes is still making it remarkably hard for builders even though they understand that demand will be significant for at least the next decade and a half given current demographics.
But the problem they will continue to face is that demand will primarily come from entry level buyers and, simply put, the cost to build a home precludes many developers from being able to meet this demand.
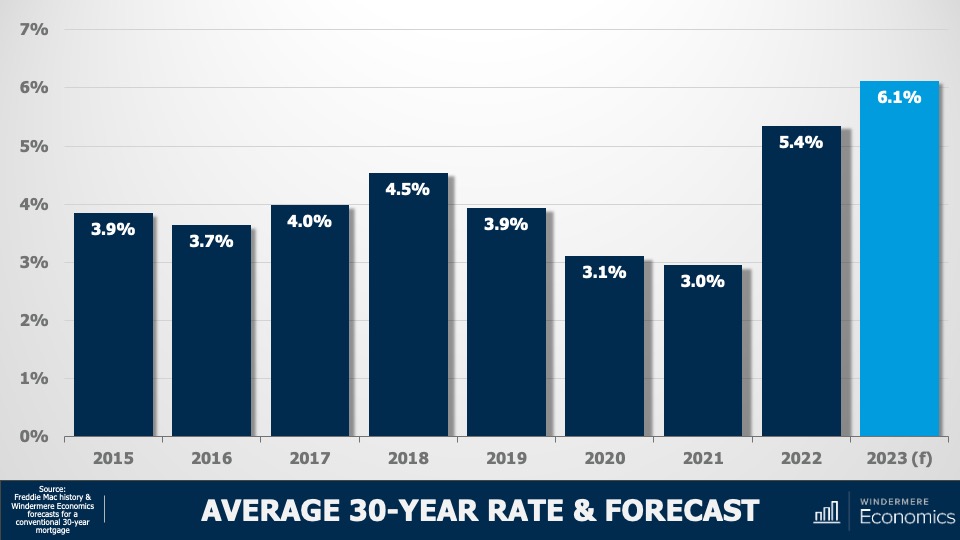
Average 30-Year Mortgage Rate & Forecast
Image Source: Matthew Gardner
And finally, my forecast for mortgage rates in 2023. Although this might not look good at all, as they say, “the devil is in the details.” Rates skyrocketed last year as the Fed stopped buying treasuries and mortgage-backed securities and, although they are off the highs we saw toward the end of last year, they are still significantly higher today than the market has become used to seeing.
As you can see here, I’m anticipating the average 30-year conventional rate to average 6.1% in 2023, but my forecast is actually a bit better than this shows.
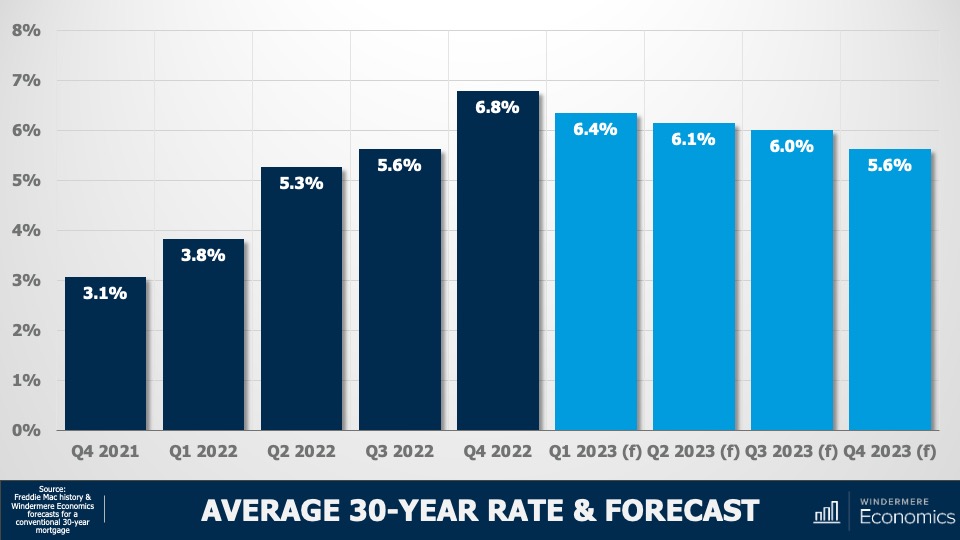
Average 30-Year Mortgage Rate Forecast 2023
Image Source: Matthew Gardner
You see, my quarterly forecast suggests that rates have actually already peaked, and that they will trend lower as we move through this year and break below 6% by the fourth quarter. I would add that if anything my forecast may be a little pessimistic, and rates may end 2023 a little lower than I am showing here.
But that will depend on the Fed, and how long they will continue raising rates, and how long it will take before they start to lower them if the US enters a recession this year, which many forecasters including myself believe will be the case.
So, there you have it, my 2023 U.S. housing forecast. I will leave you with this one last thought. 2023 will be a transition year when the housing market will come off the “high” we saw during the pandemic and borrowing costs were artificially low.
I don’t see any reason for buyers or sellers to panic though. By the end of 2023, most markets will have corrected themselves and I believe we will see prices and demand start to pick up again toward the end of this year, but at a far more normalized pace.
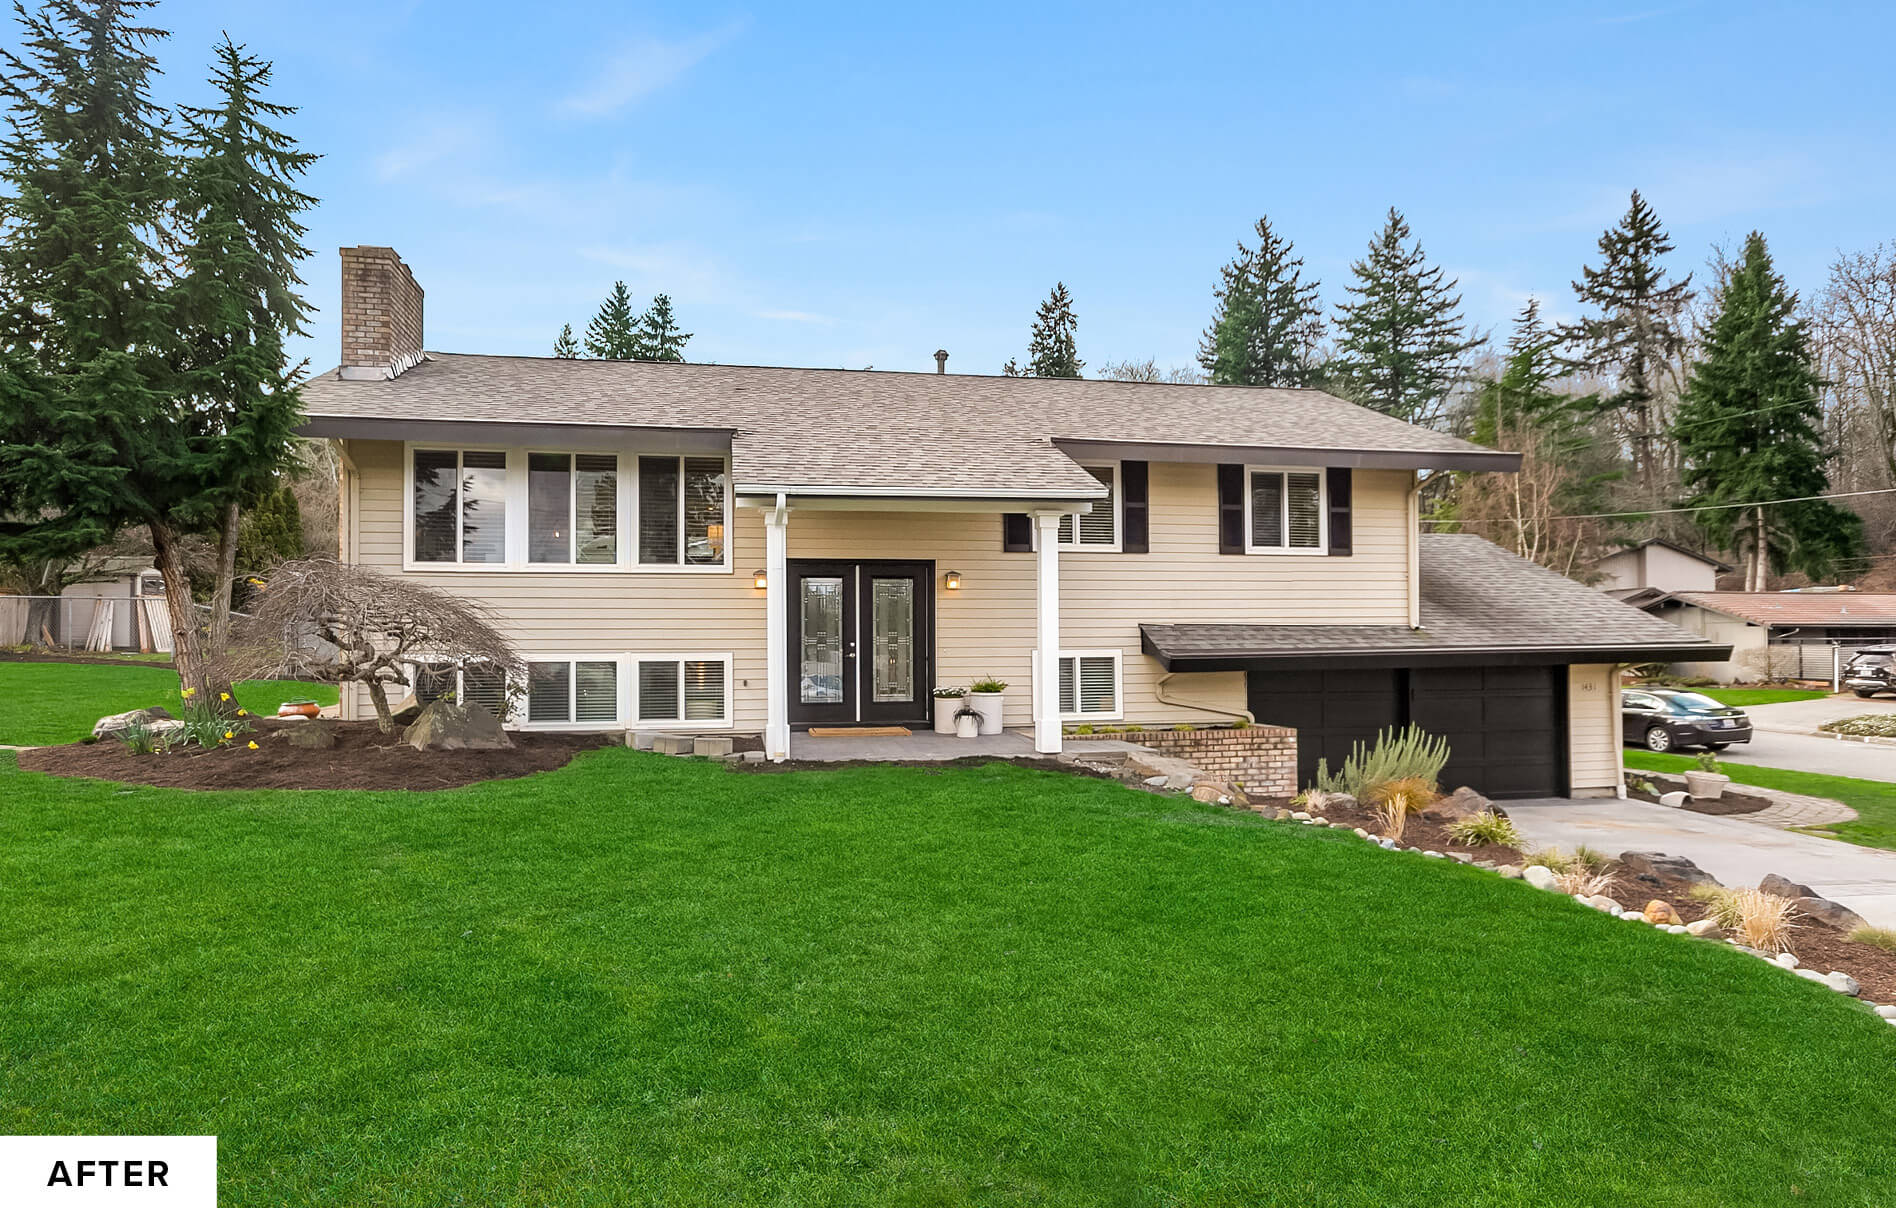
What’s the best remodeling project for your home? The answer, in part, depends on where you live. Every year, Remodeling Magazine evaluates which projects bring the most return at resale in different markets around the country in their “Cost vs. Value” report. For the purposes of this blog, we are focusing on the Pacific states (WA, OR, CA, AL) and the Mountain states (MT, ID, UT, CO, NV).
According to the Remodeling 2019 Cost vs. Value Report (www.costvsvalue.com¹), these are the six top projects in those two regions that currently have the best return on your investment when it comes time to sell.
Garage Door Replacement
The project with the most return from Washington State to Nevada? A new garage door.
In the Pacific States, replacing your garage door will cost an average $3,785, but will increase your resale value by $4,686, recouping 123.8 percent of what you paid for it. Homes in the Mountain States will also benefit from a garage door replacement, recouping 98.6 percent of their costs.
Due to its size, a garage door can have a big impact on a home’s curb appeal. But adding to your home’s aesthetic is only one advantage; the warranty that comes with the new garage door is also a selling point for potential buyers who can trust that they likely won’t have to deal with any maintenance issues in the near term.
Manufactured Stone Veneer
As long as the new stone veneer is consistent with your neighborhood’s overall look, this siding is the second-best project across the Pacific and Mountain states.
Stone veneer can replace your home’s existing siding, adding a fresh, modern look that conjures a cozy vibe all the way from the street, before buyers ever step foot inside. Along the West Coast, it can recoup 110.4 percent of the cost when you sell, and Mountain states will recoup 96.5 percent of the cost.
Wood Deck Addition
While building a deck might seem like a big undertaking, it’s actually a pretty cost-effective way to positively impact your home’s resale value. Pacific states can expect to pay around $15,000 and Mountain states just above $13,000, but they’ll see 87.8 percent and 74.3 percent recouped respectively when they sell.
Adding a deck extends the living space of your home and provides even more area for entertaining, relaxing, and enjoying the outdoors. Whether you choose a natural wood deck or a low-maintenance composite deck, you can pick from a variety of styles based on the lay of your land and the areas of your backyard you wish to highlight.
Minor Kitchen Remodel
No need to move walls or appliances around, a minor kitchen remodel will do the trick to recoup 87.1 percent of the cost in the Pacific states, and 80.3 percent in the Mountain states.
An outdated kitchen can go from drab to fab and become a focal point with a fresh palette. Replace the cabinet doors with new shaker-style wood panels and metal or metal-looking hardware. Switch out the old counter tops with laminate that matches the new look. Think about adding a resilient flooring option, then finish the project with a fresh coat of paint to the walls, trim, and ceiling.
Grand Entrance
Looking to improve your curb appeal and create an entrance that guests and homebuyers won’t soon forget? Add a fiberglass grand entrance. This project involves replacing a standard-sized front door with a larger opening with dual sidelights (glass panels). Typically costing around $8,000, Pacific states will see 85.1 percent of that recouped in the sale, and Mountain states will see 71 percent.
Siding Replacement
Depending on the size of your home, replacing the siding can be an expensive undertaking. However, it’s a project that comes with high returns. For Mountain states, sellers can expect 75.4 percent of the costs recouped, and Pacific sellers will see 84.3 percent.
Not only is siding one of the first things a buyer sees, but it also serves as an indicator of the overall health of the home. Broken or damaged siding could mean that there are other problems with the home, such as pests and rot. Replacing old siding is a cost-effective way to boost your home’s curb appeal and ensure buyers are going to walk through your front door.
At the end of the day, the right remodeling projects for you are the ones that make sense for your household and are within your budget. Talk to us about which remodeling projects could add the most value to your home.
Homeowners who are preparing to sell are often faced with a dilemma about whether to remodel or sell their home in its current state. Each approach has its respective advantages and disadvantages. If you decide to remodel your home, it will likely sell for more; but the increased selling price will come at the cost of financing the remodeling projects. If you decide to sell without remodeling, you won’t spend as much money putting your home on the market, but the concern is whether you’re leaving money on the table.
Should I Remodel or Sell My House As Is?
To answer this question, it’s important to understand the factors that could influence your decision and to work closely with your agent throughout the process.
Cost Analysis: Home Remodel vs. Selling Your Home As Is
Home Remodel
When you remodel your home before selling, you’re basically making a commitment to spend money to make money. So, it’s important to consider the kind of ROI you can expect from different remodeling projects and how much money you’re willing to spend. Start by discussing these questions with your agent. They can provide you with information on what kinds of remodels other sellers in your area are making and the returns they’re seeing as a result of those upgrades. This will help you determine the price of your home once your remodel is complete.
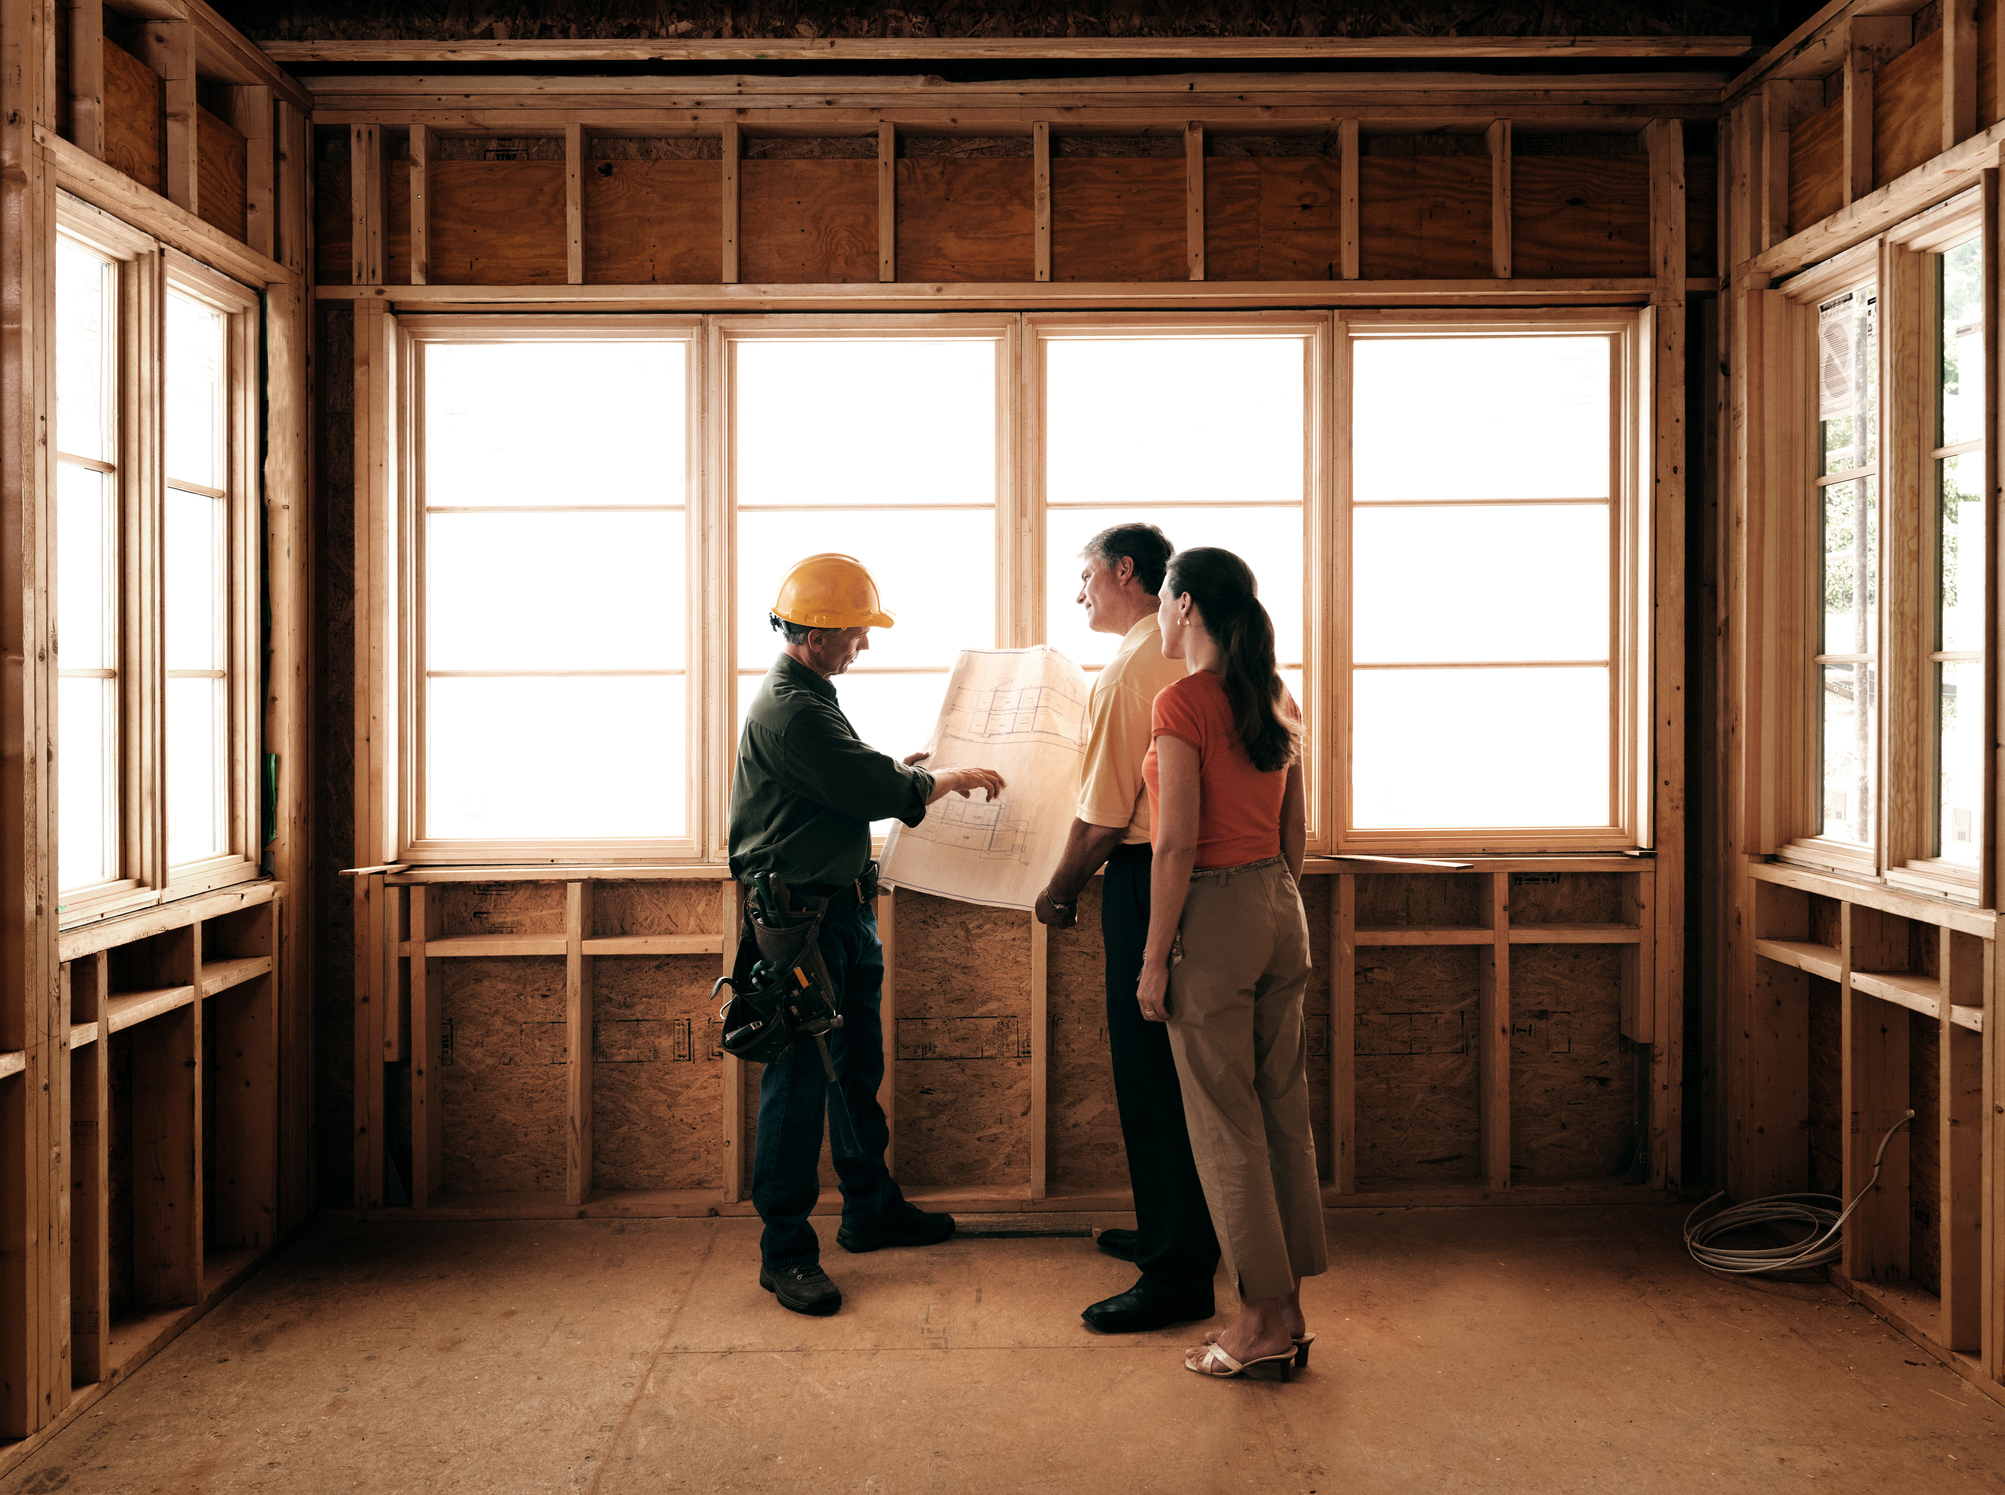
Then, there’s the question of whether you can complete you remodeling projects DIY or if you’ll need to hire a contractor. If hiring a contractor seems expensive, know that those costs come with the assurance that they will perform quality work and that they have the skill required to complete highly technical projects.
According to the Remodeling 2021 Cost vs. Value Report (www.costvsvalue.com1), on average, homeowners paid roughly $24,000 for a midrange bathroom remodel and about $26,000 for a minor kitchen remodel nationwide, with a 60.1% and 72.2% ROI respectively. This data shows that, for these projects, you can recoup a chunk of your costs, but they may not be the most cost-effective for you. A more budget-friendly approach to upgrading these spaces may look like repainting your kitchen cabinets, swapping out your old kitchen backsplash for a new one, refinishing your bathroom tub, or installing a new showerhead. Other high-ROI remodeling projects may allow you to get more bang for your buck, such as a garage door replacement or installing stone veneer. To appeal to sustainable-minded buyers, consider these 5 Green Upgrades that Increase Your Home Value.
Deciding not to remodel your home will come with its own pros and cons. By selling as is, you may sell your home for less, but you also won’t incur the cost and headache of dealing with a remodel. And since you’ve decided to sell, you won’t be able to enjoy the fruits of the remodel, anyway. If you sell your home without remodeling, you may forego the ability to pay down the costs of buying a new home with the extra money you would have made from making those upgrades.
Market Conditions: Home Remodel vs. Selling Your Home As Is
Local market conditions may influence your decision of whether to remodel before selling your home. If you live in a seller’s market, there will be high competition amongst buyers due to a lack of inventory. You may want to capitalize on the status of the market by selling before investing time in a remodel since prices are being driven up, anyway. If you take this approach, you’ll want to strategize with your agent, since your home may lack certain features that buyers can find in comparable listings. In a seller’s market, it is still important to make necessary repairs and to stage your home.
In a buyer’s market, there are more homes on the market than active buyers. If you live in a buyer’s market, you may be more inclined to remodel your home before selling to help it stand out amongst the competition.
Timing: Home Remodel vs. Selling Your Home As Is
Don’t forget that there is a third option: to wait. For all the number crunching and market analysis, it simply may not be the right time to sell your home. Knowing that you’ll sell your home at some point in the future—but not right now—will allow you to plan your remodeling projects with more time on your hands which could make it more financially feasible to complete them.
The interior design trends of 2022 included a renaissance of colorful decorating, a preference for sustainable materials, and incorporating nature throughout the home. They reflected the continued evolution of our lifestyles in recent years and showed an overall desire for our homes to be somewhere we can relax, decompress, and focus on our wellbeing.
With 2023 just around the corner, expect to see the latest design trends continue that trajectory of creating a home that’s vibrant yet soothing.
5 Interior Design Trends for 2023
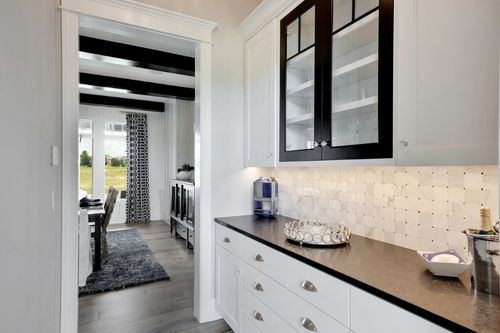
1. Butler’s Pantries
There’s something endlessly fascinating about features throughout a home that tie spaces together and create harmony. A butler’s pantry is the perfect resource for homeowners who feel their kitchens are always running at capacity. Typically located adjacent to the kitchen or dining room, modern butler’s pantries are often concealed behind cabinets or pocket doors. An economical solution for food and kitchen item storage, they allow you to prep meals outside the kitchen, gather silverware, and prepare to set the table. Kitchens are the heart of the home, and this space has taken on even more significance in recent years. It’s no wonder these special home features are on the rise.
Image Source: Getty Images – Image Credit: PC Photography
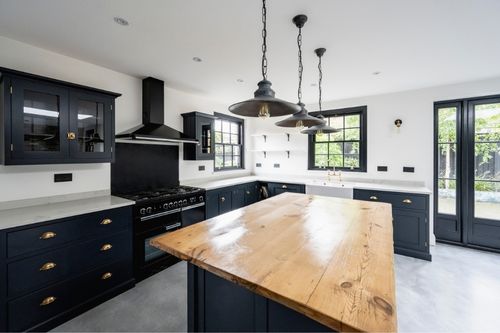
2. Colorful Kitchens
Color in the kitchen is back in style! The neutral-toned backdrop of farmhouse-style interiors that leapt to the forefront of home design in recent years is still popular, but homeowners can expect to see more bold colors in 2023. The kitchen island, cabinets, and backsplash are three target areas for adding color to your kitchen. These large surface areas are tailor-made for color splashes to lead the eye throughout the room. Experiment with complimentary tile designs, two-toned cabinets, and dark-stained wood to create a kitchen atmosphere that feels anything but bland.
In some ways, the design trends that defined 2022 will continue into next year. One such trend that will ring true in 2023 is a desire to fill the home with organic materials. Indoor plants will continue to be a popular decorative item throughout the home, both for their health benefits and their ability to mix and match with any décor style. In the living room, natural materials like stone, wood, and organic fabrics will help tie a home’s organic aesthetic together. And in the kitchen, stone and marble countertops add an earthy touch.
While bold colors are making their return to the kitchen, earth tones will help to balance out homeowners’ interior design palettes next year. Many design leaders’ color of the year selections for 2023 are in, all showcasing unconventional takes on earthy colors. Whether it’s beige, magenta, cream, or forest green, you can use these shades throughout your home to create balance and ground your bolder color choices elsewhere. Looking to swap out your grey couch? Have you always wanted to paint your gallery wall something other than off-white? Now is the time!
Homeowners have made significant adjustments to their lifestyles in recent years. For many, that’s meant spending time on their hobbies, exercising, and working on passion projects at home, whereas previously they may have gone elsewhere. After a couple years of making do with whatever space was available, moving forward, we’ll see a more intentional approach to creating space at home for those activities. Whether it’s building out a home gym, setting up your home office, craft room, art studio, yoga sanctuary, etc., having a dedicated area allows for privacy and focus while doing the things you love.
Image Source: Getty Images – Image Credit: Petar Chernaev
Interior design trends continue to evolve with our lifestyles and needs as homeowners.
It’s natural for sellers to want to get every step of the selling process right, but a successful home sale depends on an accurate listing price. Your agent will work closely with you to set the price, but in the meantime, you can use the following information to better understand what goes into this process.
Nothing can replace the professional knowledge and local expertise of a real estate agent, but automated valuation models (AVMs) can be a helpful first step in determining what your home is worth. Like comps, AVMs assess your home by comparing its information with the listings in your area. Windermere’s Home Worth Calculator evaluates your property and the surrounding market to give you an idea of how much it’s worth. Try it here:
What factors influence home prices?
Understanding what factors influence home prices will give you a deeper knowledge of the market, give clarity to the selling process, and help you work with your agent to accurately price your home.
Comparable Home Sales
Comparable home sales—or “comps”—have a major impact on the price of your home. Comps refer to the comparable homes in your area, both pending and sold, within the last six months. Your Windermere agent can provide you with a Comparative Market Analysis (CMA) to better determine the price of your home. CMAs factor in aspects such as square footage, age, and lot size compared to other homes in your area, to determine how your home should be priced among the competition.
Your Home’s Location
Naturally, your home’s location plays a significant role in its asking price. Depending on the market conditions in your area, whether you reside in a metropolitan, suburban, or rural location, and the home’s proximity to amenities, schools, and entertainment all contribute to the price.
If you have recently invested in upgrades or other remodeling projects for your home, they could increase your asking price. However, the price increase potential depends on the kind of renovation, its ROI, and how valuable it is to buyers in your area. If the home needs repair, it will likely generate less interest from buyers than better maintained homes at your price point. Any outstanding repairs or projects looming overhead will make the home less attractive to buyers and could lead to a low appraisal.
Seasonality
Any factors that impact market supply and demand are worth taking into consideration when preparing to price your home, and seasonality is one that cannot be overlooked. Typically, market activity slows in the winter and picks up during the spring and summer months. However, market seasonality varies region to region. Talk to your Windermere agent about the seasonality trends in your area and how they factor into your asking price.
Market Conditions
Naturally, all sellers want to price their home competitively, but what a competitive price looks like depends on the market conditions, such as whether it’s a buyer’s or seller’s market. Some sellers think that pricing their home over market value means they’ll sell for more money, but the opposite can often be true. Overpricing your home presents various dangers such as sitting on the market too long, which can result in selling for well below what it’s worth.
Periodic Price Adjustments
Pricing a home isn’t a set-it-and-forget-it proposal. As with any strategy, you need to be prepared to adapt to fast-changing market conditions, new competition, a lack of offers, and other outside factors.
These are the basic tenets for understanding what goes into the price of a home. When you’re ready, a Windermere agent will interpret and expand on this information, perform a CMA for your home, and guide you throughout your selling journey.
The following analysis of select counties of the Western Washington real estate market is provided by Windermere Real Estate Chief Economist Matthew Gardner. We hope that this information may assist you with making better-informed real estate decisions. For further information about the housing market in your area, please don’t hesitate to contact your Windermere Real Estate agent.
Regional Economic Overview
The Western Washington labor market continues to expand. The addition of 110,000 jobs over the past 12 months represents an impressive increase of 4.9%. All but seven counties have recovered completely from their pandemic job losses. In total, the region has recovered all the jobs lost and has added an additional 30,000 new positions. The regional unemployment rate in August was 3.8%. This is .2% higher than at the end of the second quarter. That said, county data is not seasonally adjusted, which is likely the reason for the modest increase. The labor force has not expanded at its normal pace, which is starting to impact job growth. Although the likelihood of a recession starting at some point this winter has risen, I am not overly concerned at this point; however, I anticipate businesses may start to taper hiring if they feel demand for their goods and services is softening.
Western Washington Home Sales
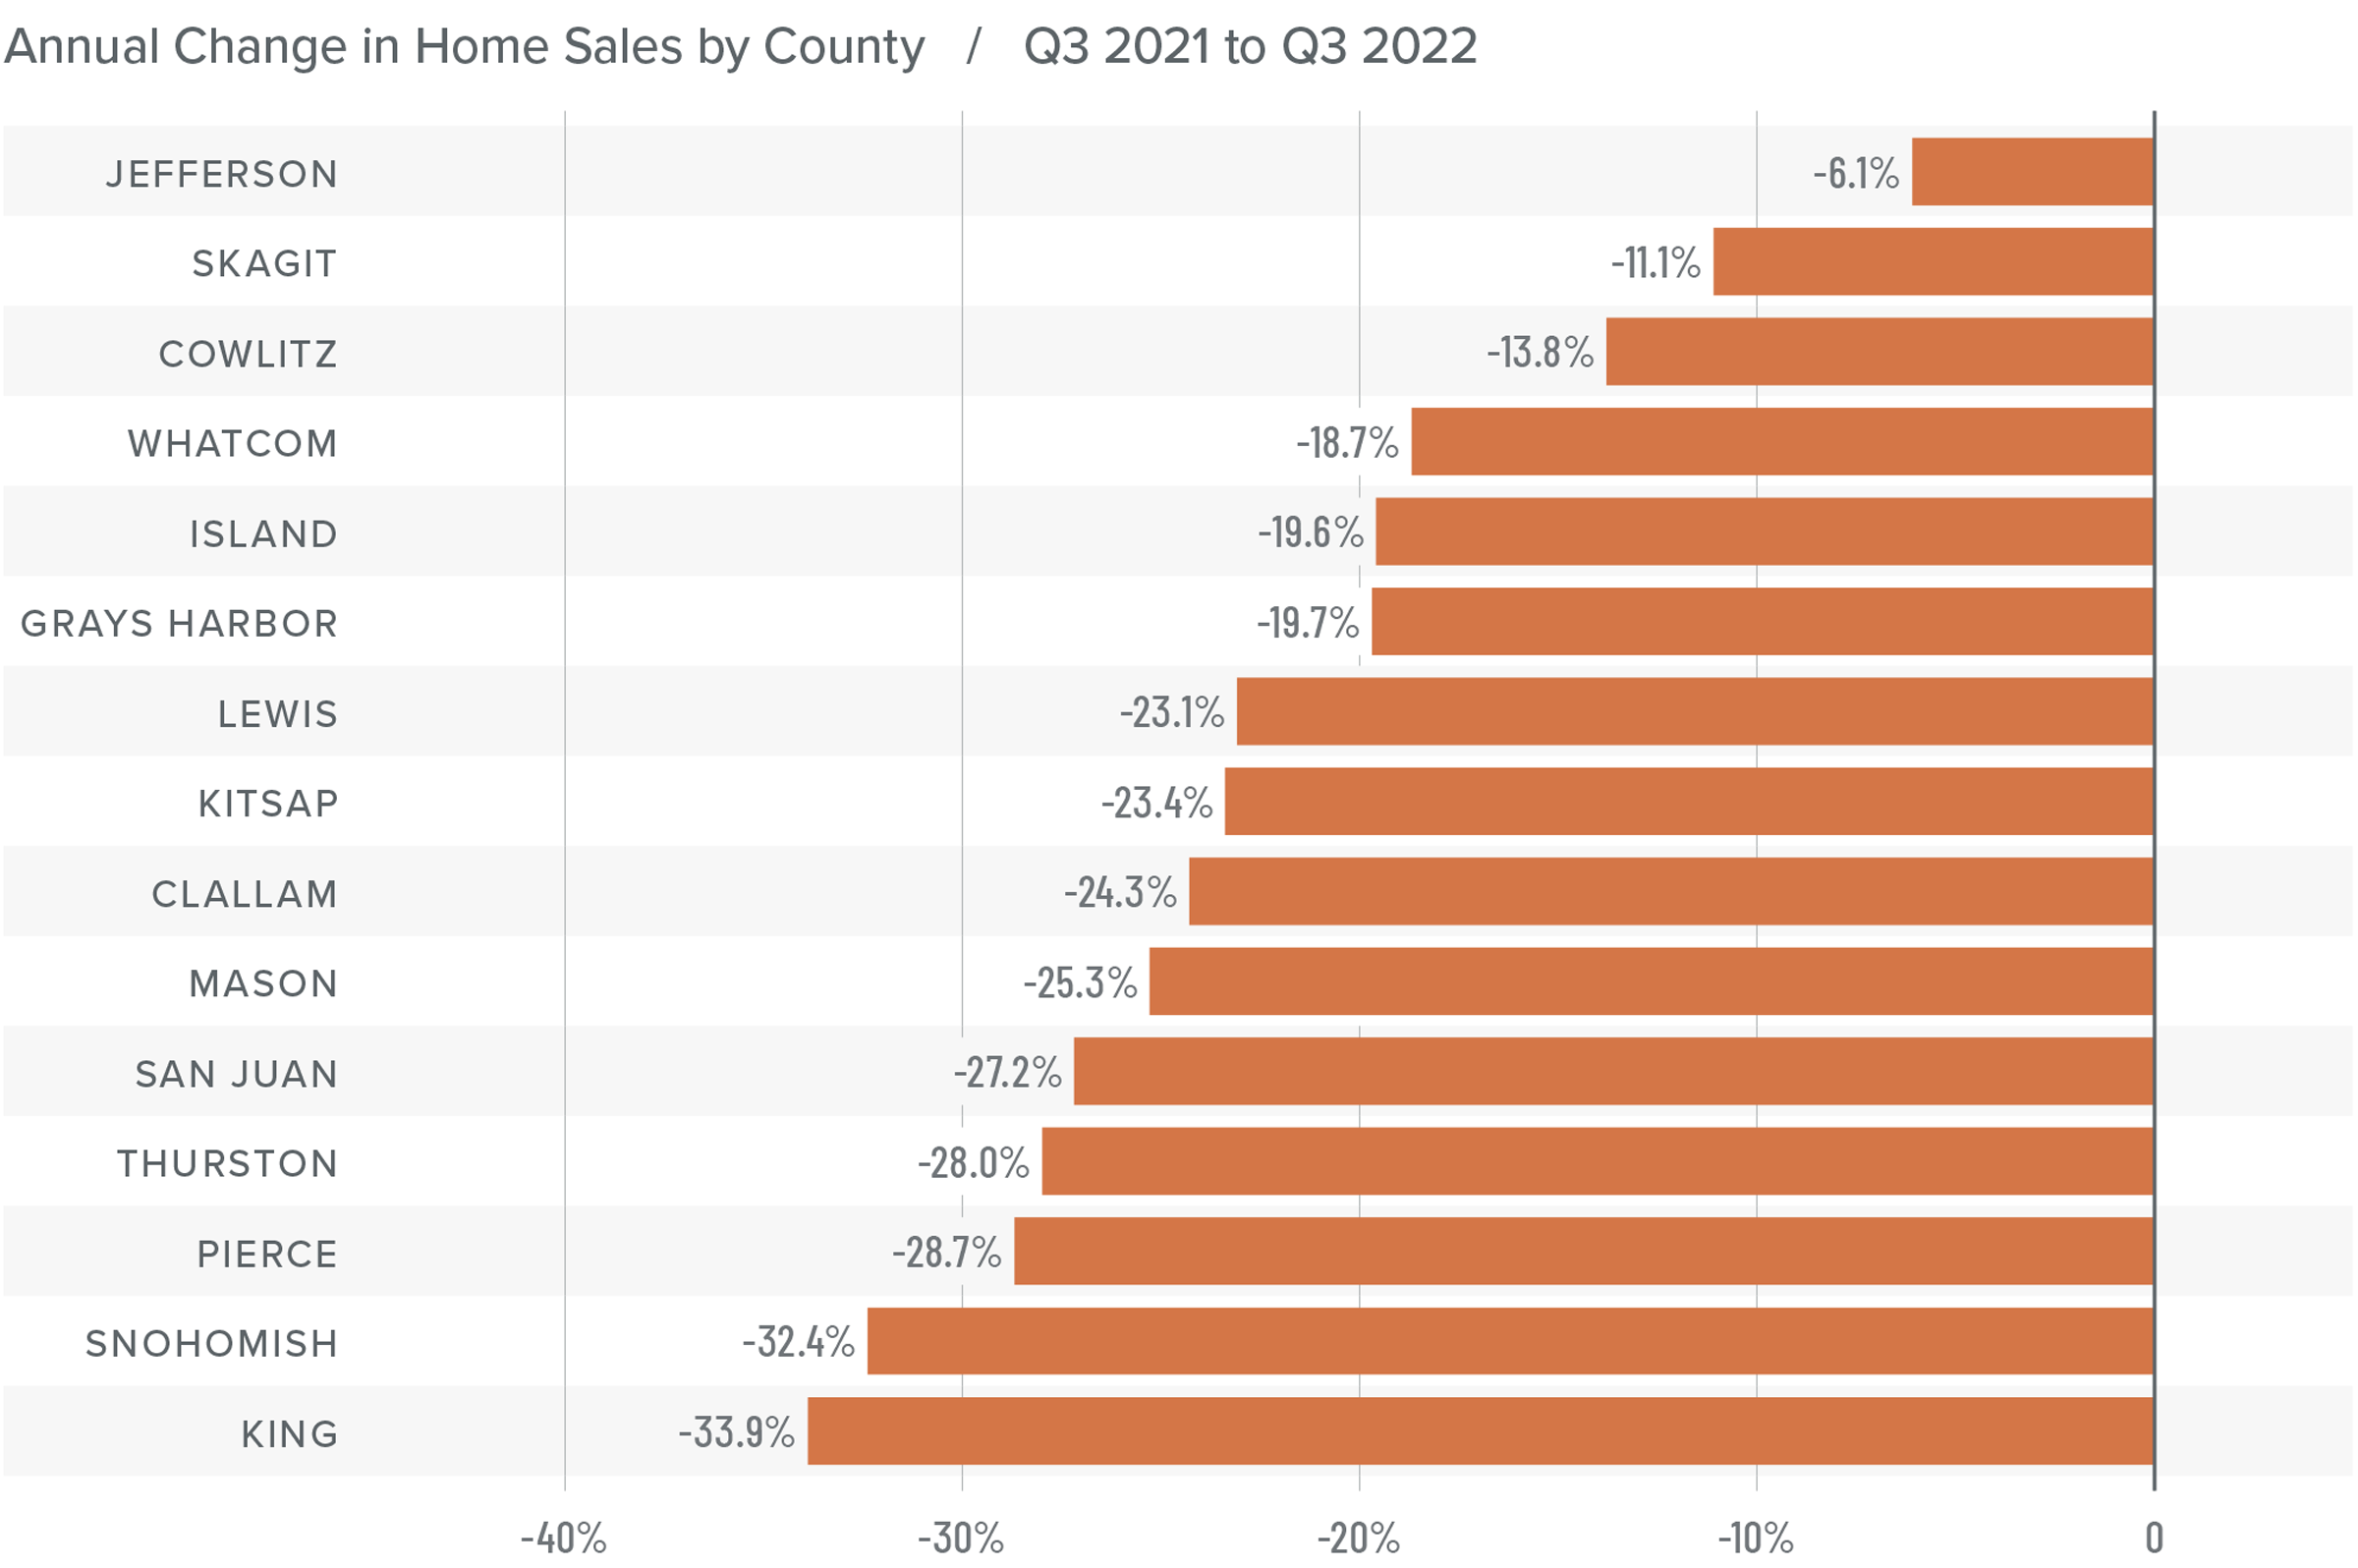
❱ In the third quarter, 19,455 homes traded hands, representing a drop of 29.2% from the same period a year ago. Sales were 15.4% lower than in the second quarter of this year.
❱ Listing activity continues to increase, with the average number of homes for sale up 103% from a year ago and 61% higher than in the second quarter of 2022.
❱ Year over year, sales fell across the board, but when compared to second quarter they were higher in Mason, Cowlitz, Jefferson, and Clallam counties.
❱ Pending sales (demand) outpaced listings (supply) by a factor of 1:6. This ratio has been dropping for the past three quarters and indicates a market moving back toward balance. The only question is whether it will overshoot and turn into a buyer’s market.
Western Washington Home Prices
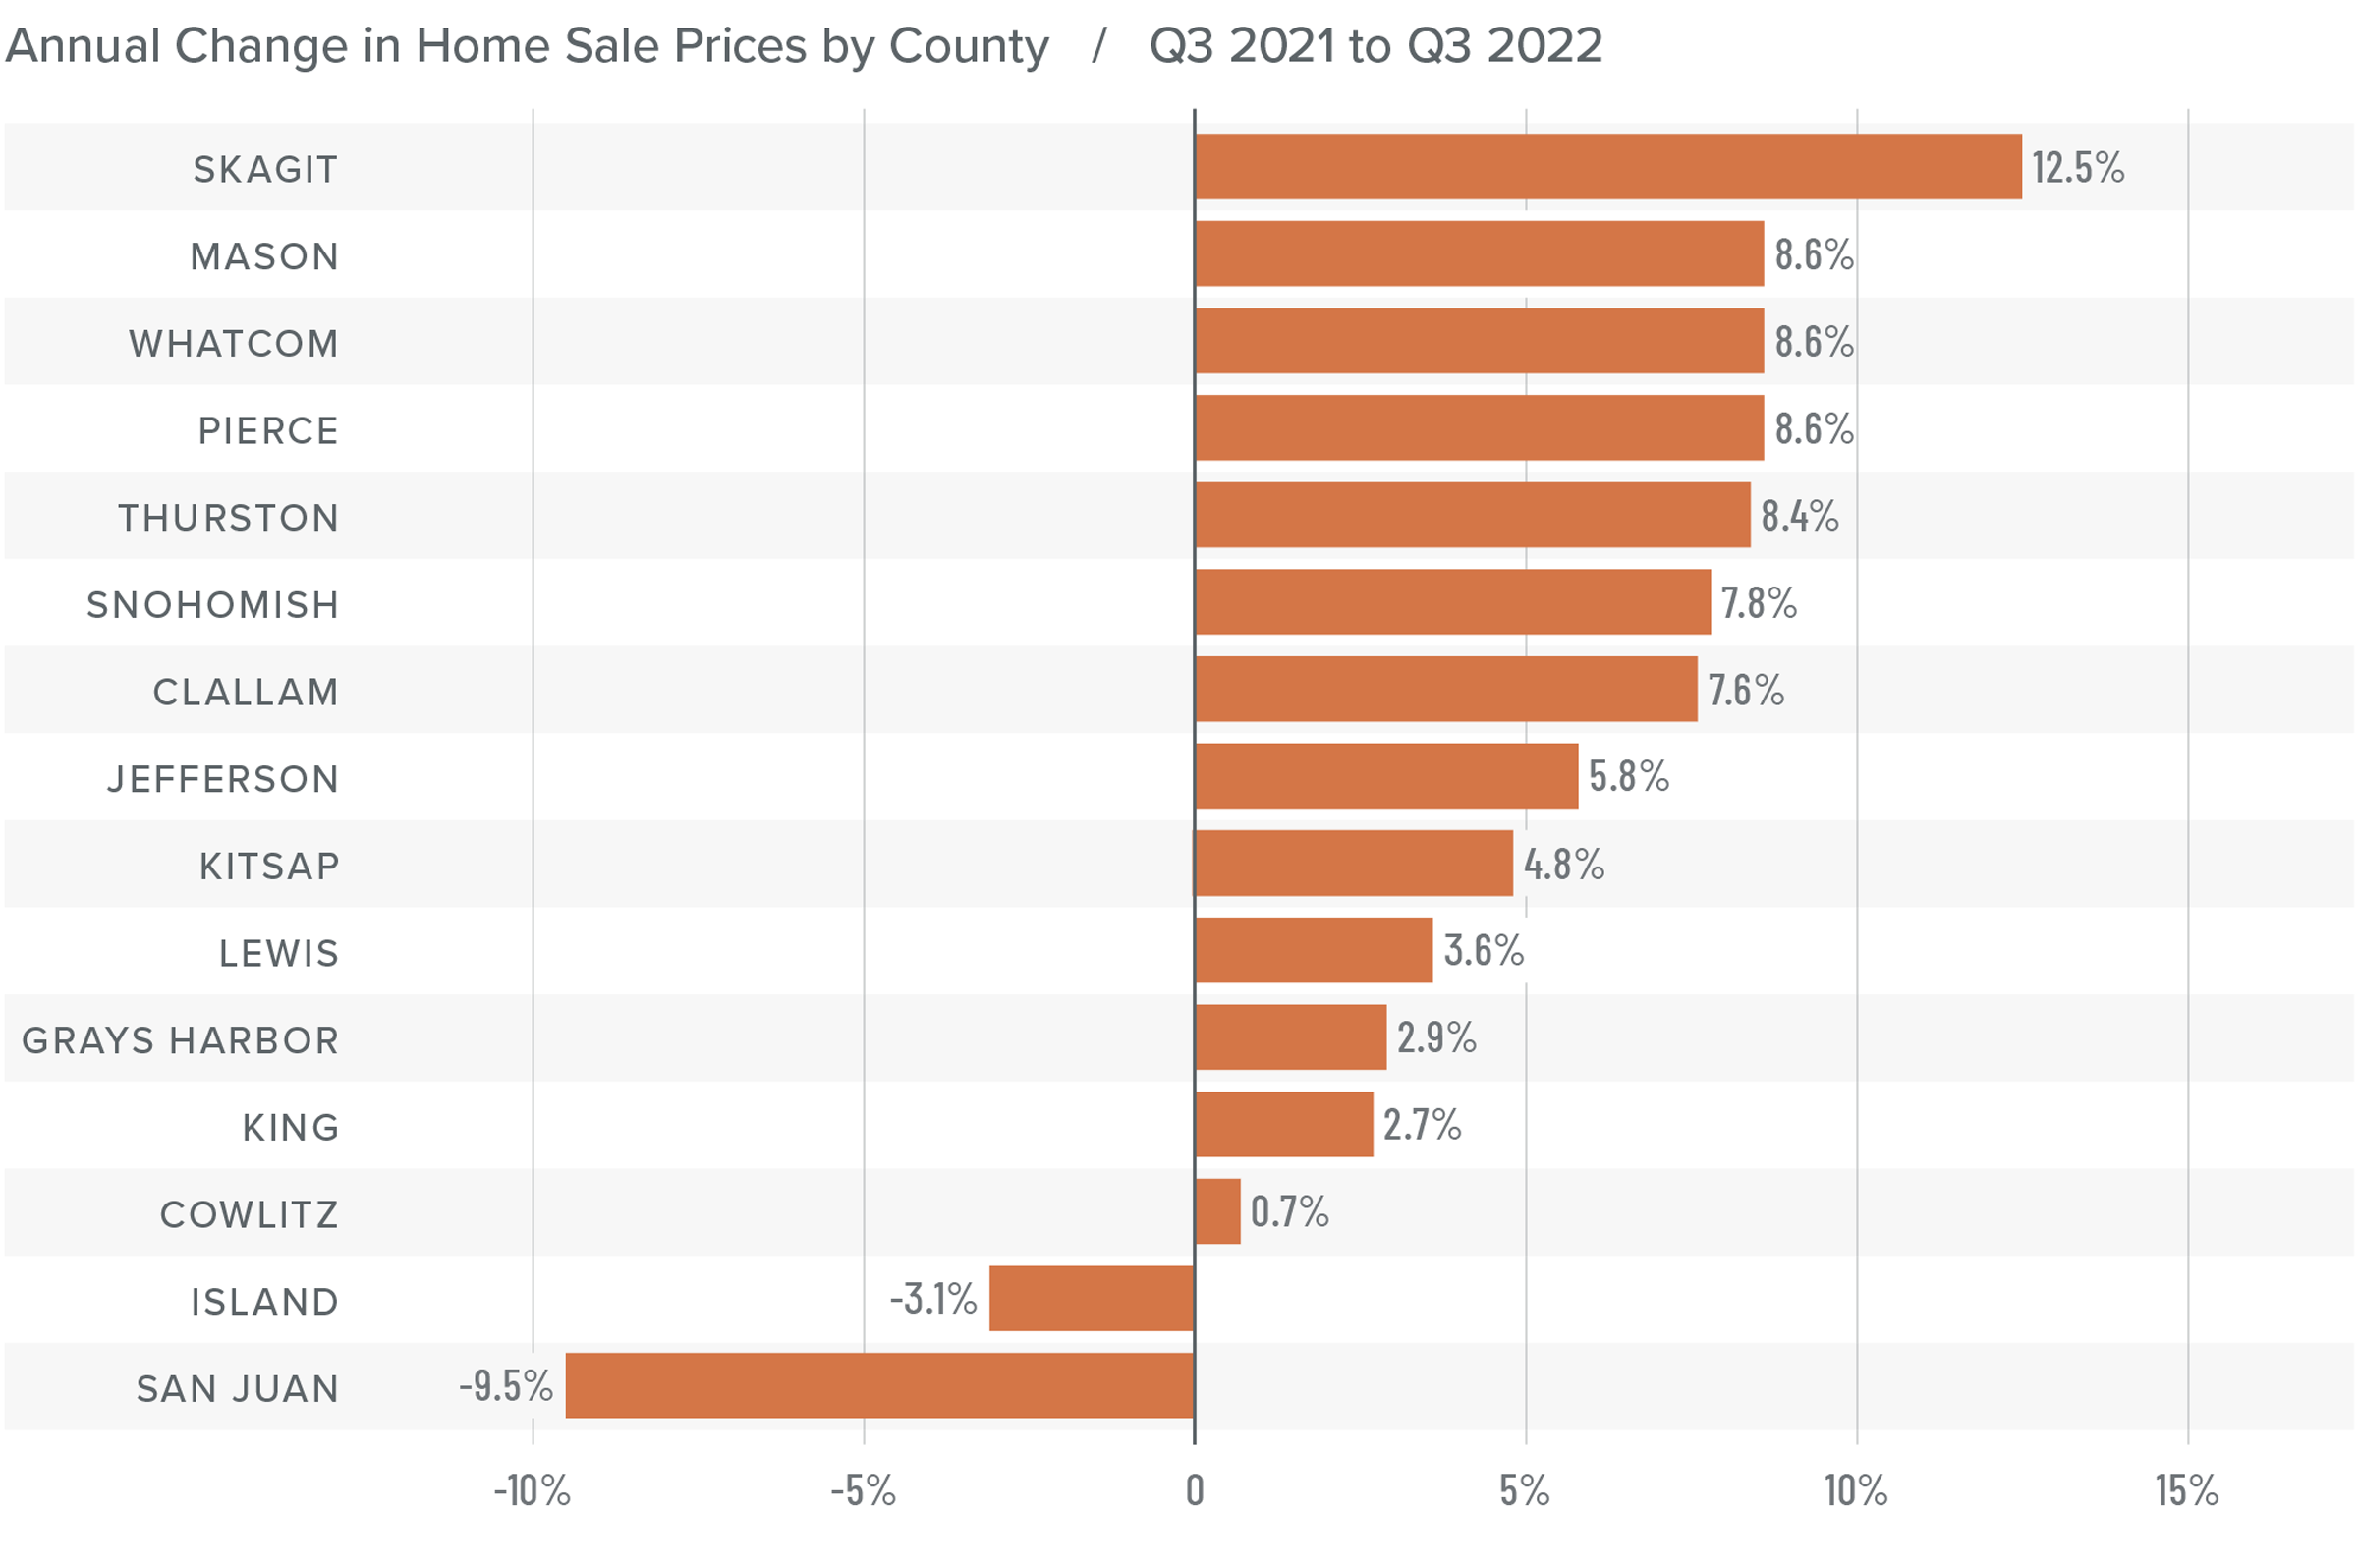
❱ Higher financing costs and more choice in the market continue to impact home prices. Although prices rose an average of 3.6% compared to a year ago, they were down 9.9% from the prior quarter. The current average sale price of a home in Western Washington is $748,569.
❱ The change in list prices is a good leading indicator and we have seen a change in the market. All but two counties (Island and Jefferson) saw median list prices either static or lower than in the second quarter of 2022.
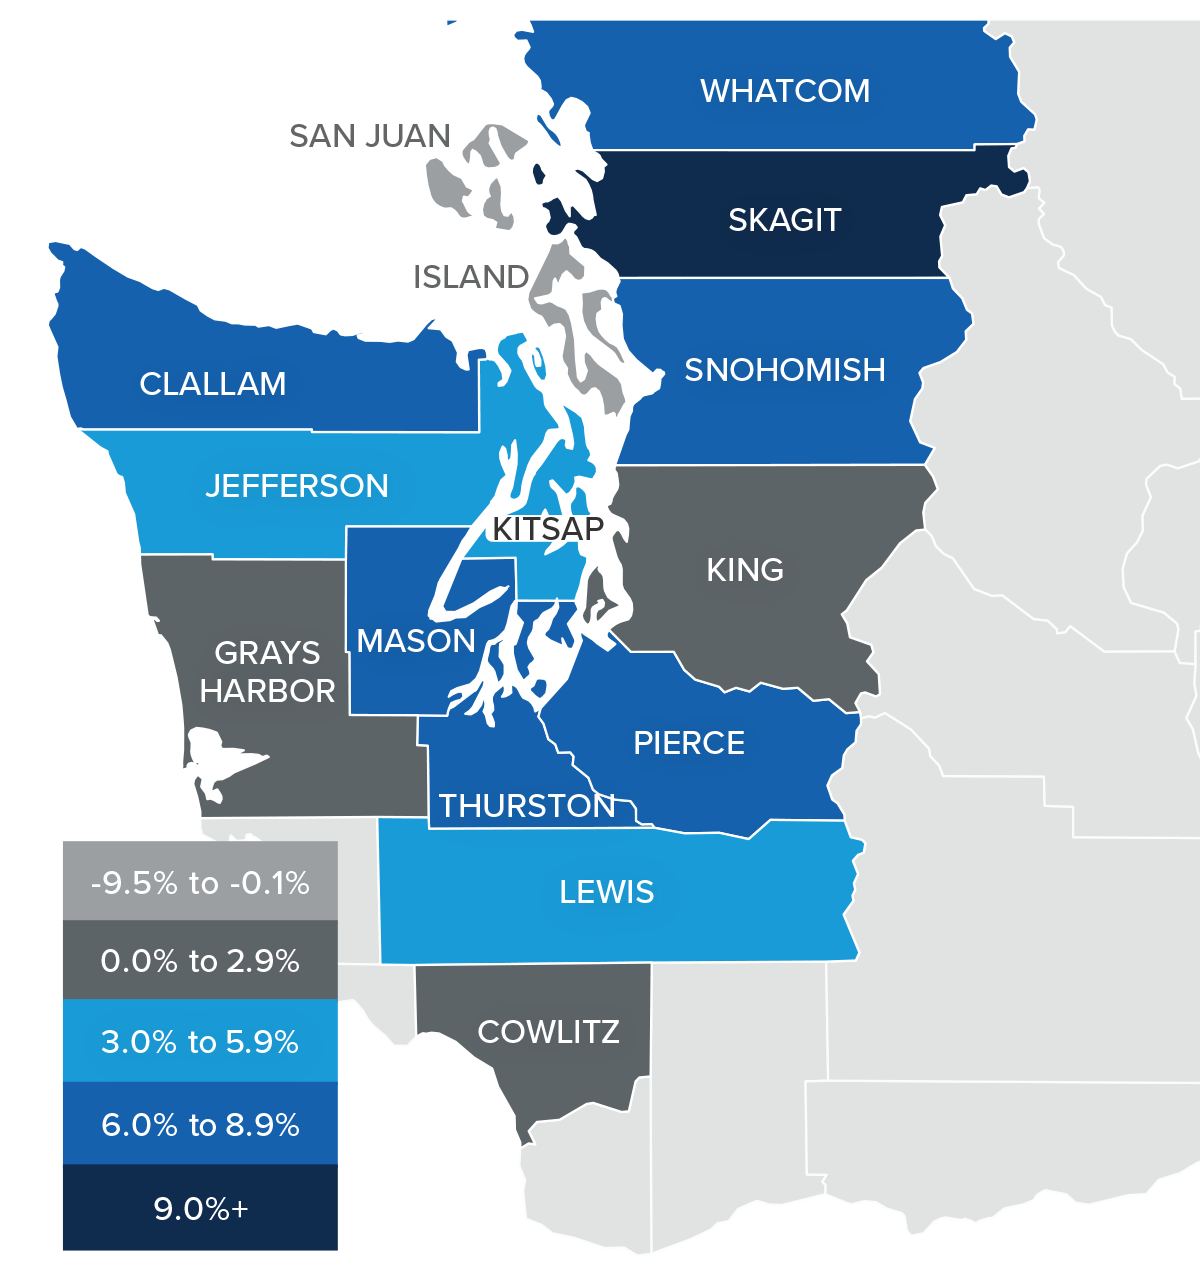
❱ Prices rose in all but two counties, and several counties saw price growth well above their long-term averages.
❱ With the number of homes for sale rising and list prices starting to pull back, it’s not surprising to see price growth falter. We are going through a reversion following the overstimulated market of 2020 and 2021. There will be some ugly numbers in terms of sales and prices as we move through this period of adjustment, but the pain will be temporary.
Mortgage Rates
This remains an uncertain period for mortgage rates. When the Federal Reserve slowed bond purchases in 2013, investors were accused of having a “taper tantrum,” and we are seeing a similar reaction today. The Fed appears to be content to watch the housing market go through a period of pain as they throw all their tools at reducing inflation.
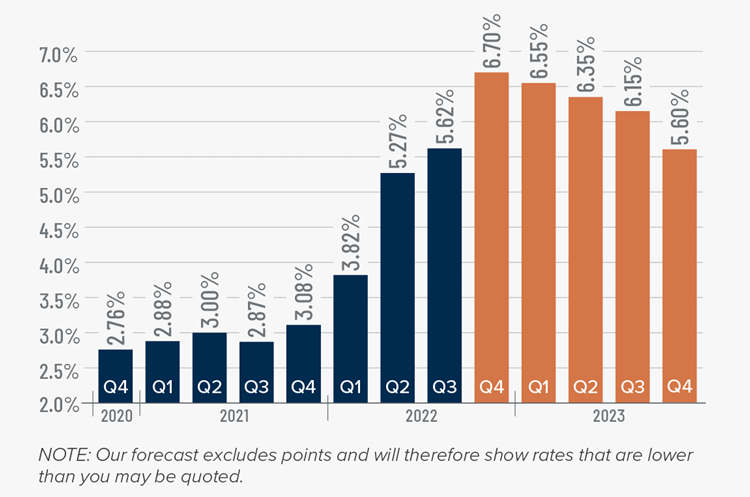
As a result, mortgage rates are out of sync with treasury yields, which not only continues to push rates much higher, but also creates violent swings in both directions. My current forecast calls for rates to peak in the fourth quarter of this year before starting to slowly pull back. That said, they will remain in the 6% range until the end of 2023.
Western Washington Days on Market
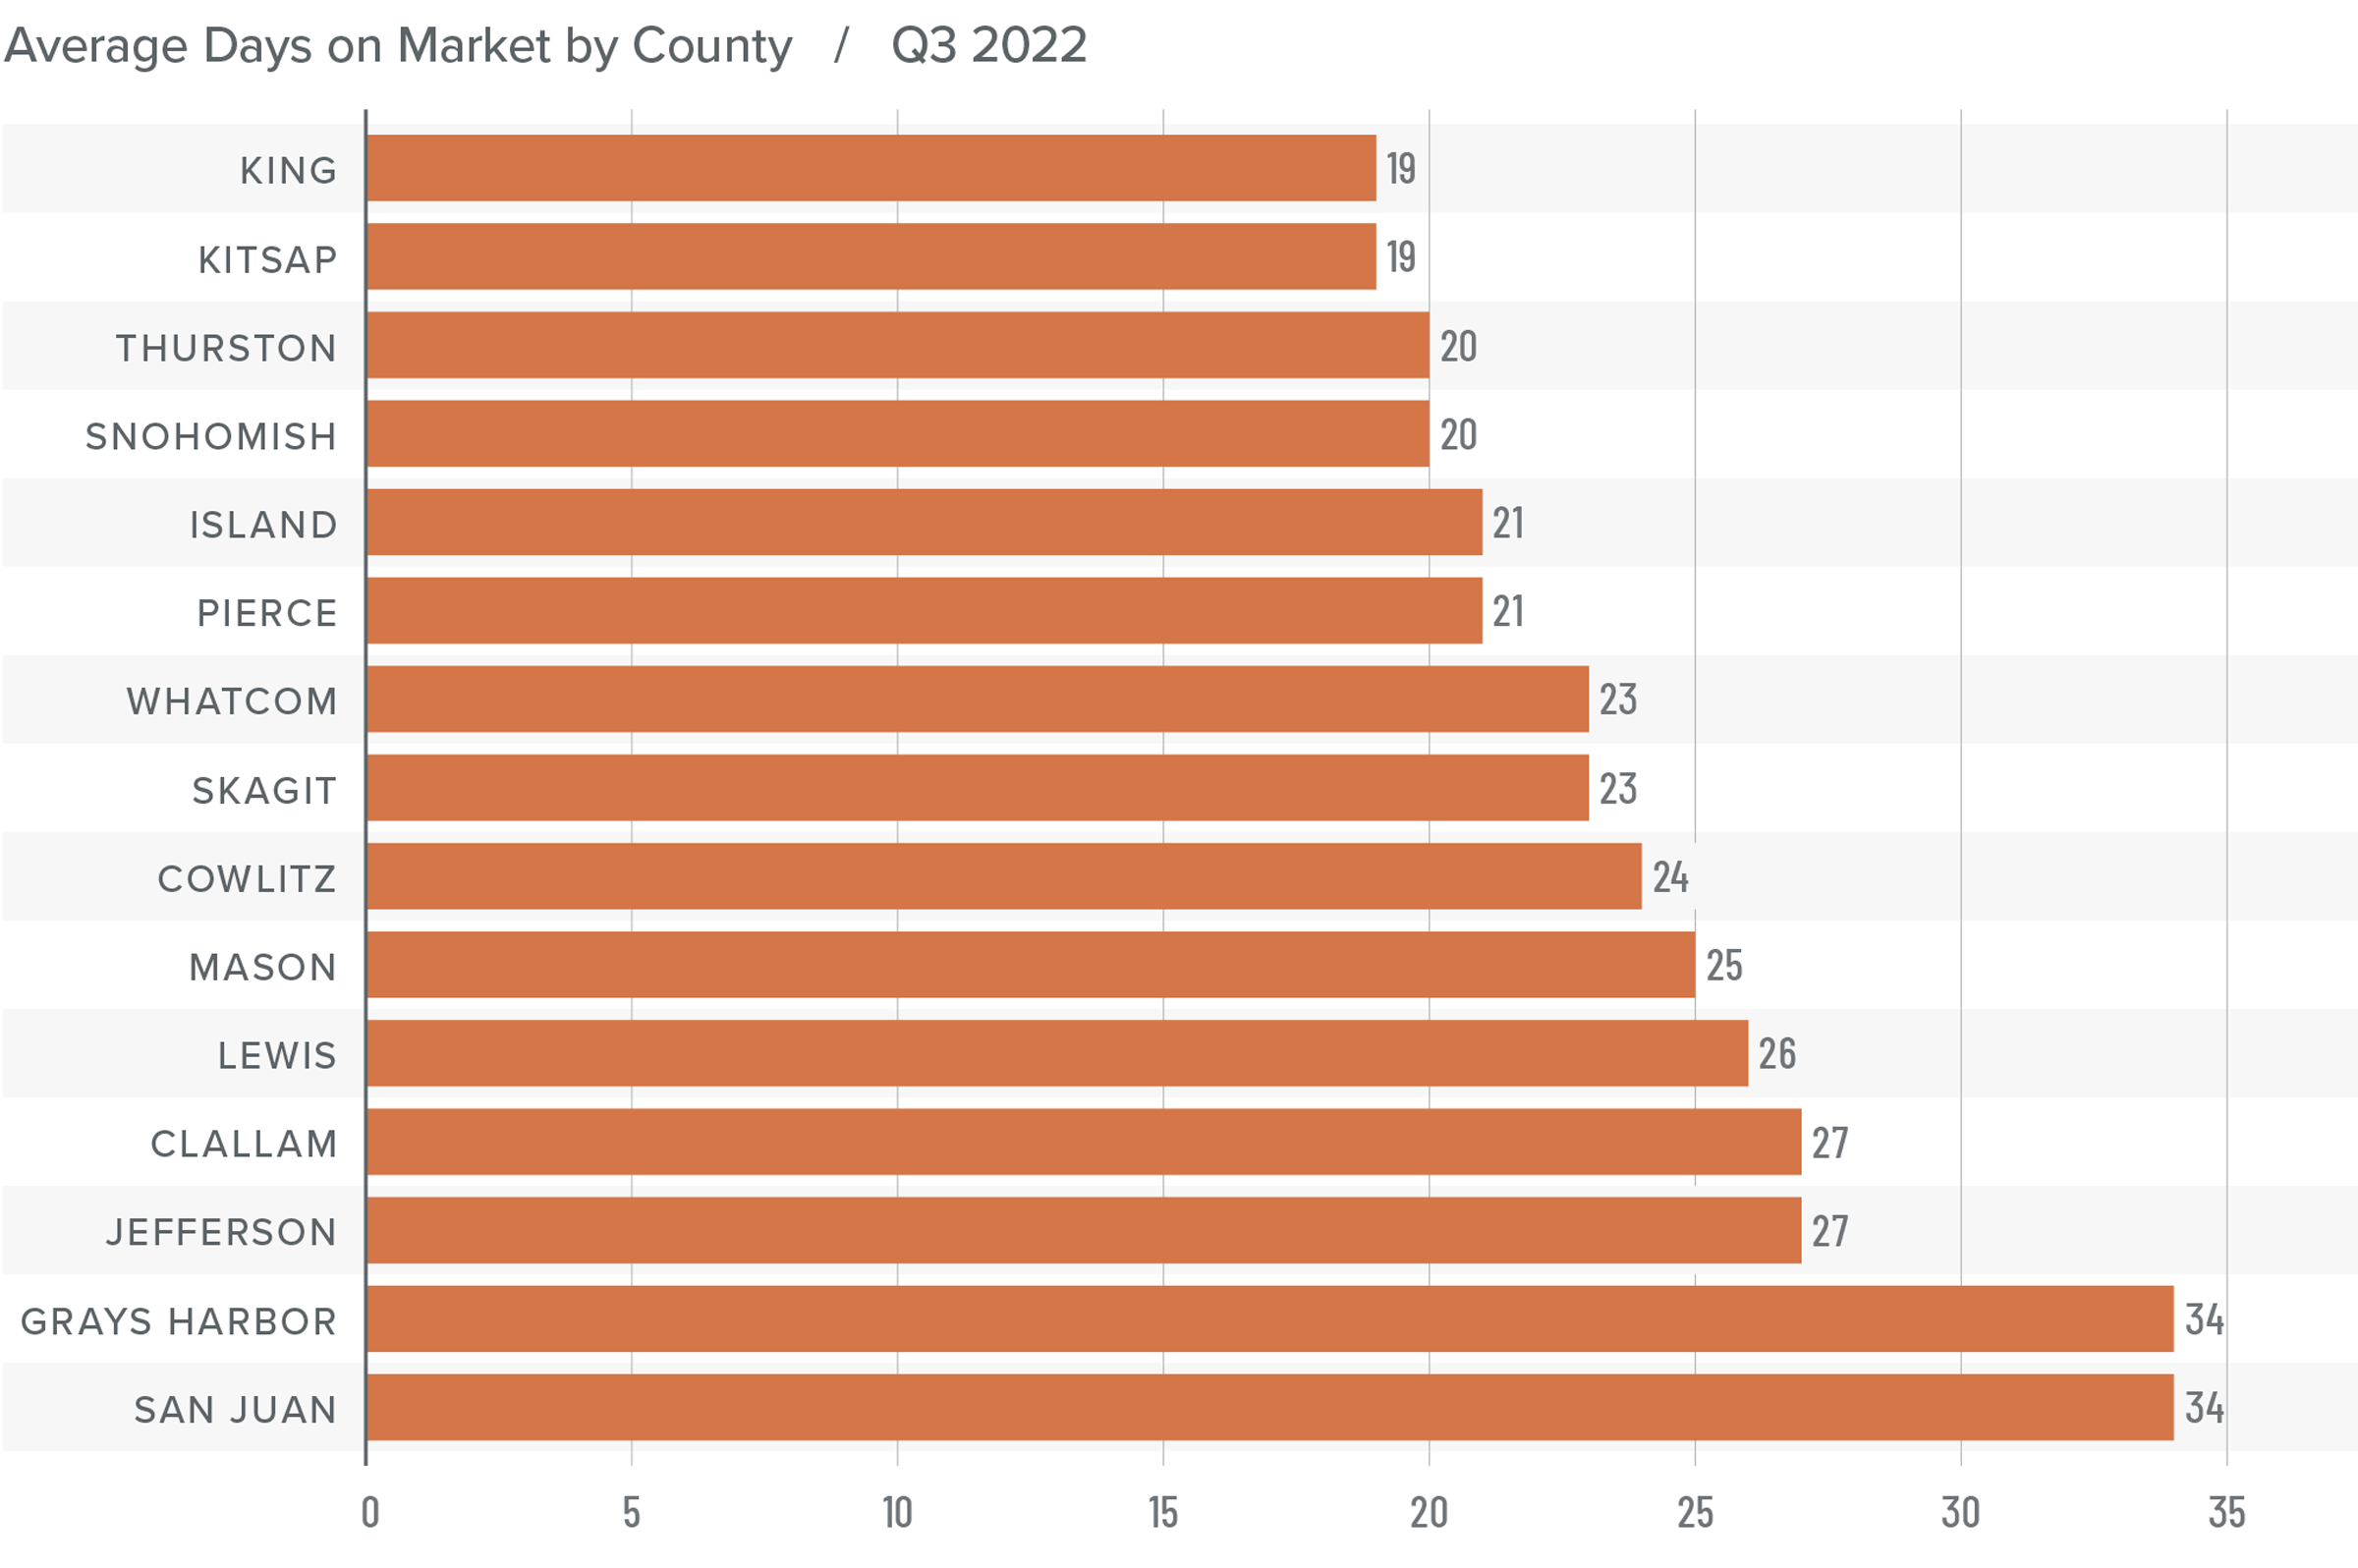
❱ It took an average of 24 days for a home to sell in the third quarter of the year. This was seven more days than in the same quarter of 2021, and eight days more than in the second quarter.
❱ King and Kitsap counties were the tightest markets in Western Washington, with homes taking an average of 19 days to sell.
❱ Only one county (San Juan) saw the average time on market drop from the same period a year ago. San Juan was also the only county to see market time drop between the second and third quarters of this year.
❱ The greatest increase in market time compared to a year ago was in Grays Harbor, where it took an average of 13 more days for homes to sell. Compared to the second quarter of 2022, Thurston County saw average market time rise the most (from 9 to 20 days).
Conclusions
This speedometer reflects the state of the region’s real estate market using housing inventory, price gains, home sales, interest rates, and larger economic factors.
Listings are up, sales are down, and a shift toward buyers has started. After a decade of sellers dominating the market, it is far too early to say that the shift is enough to turn the market in favor of buyers, but the pendulum has started to swing in their direction. A belief that the housing market is on its way to collapsing will keep some buyers sidelined, while others may be waiting for mortgage rates to settle down. Whatever their reasons, I maintain that we will see a brief period where annual price growth will turn negative in several markets, but it is only because the market is normalizing. I certainly don’t see any systemic risk of home values falling like they did in the mid-to-late 2000s.
All things considered, I have moved the needle toward buyers, but it remains, for the time being, a seller’s market.
A little while ago, a housing analyst was being interviewed about the current state of the residential market and they suggested that the country is in a “housing recession.” Well, needless to say, this got a lot of attention from the media and the public at large—for obvious reasons.
Any time the word “recession” is mentioned we almost subliminally cast our minds back to 2007. And when the word “recession” is combined with the word “housing,” then panic starts to set in with flashbacks of headlines about burgeoning housing supply, plummeting home prices, and surging foreclosures.
As this is a topic being discussed by many across the country right now, I wanted to share with you my opinion as to whether the phrase “housing recession” is an appropriate one when describing today’s market.
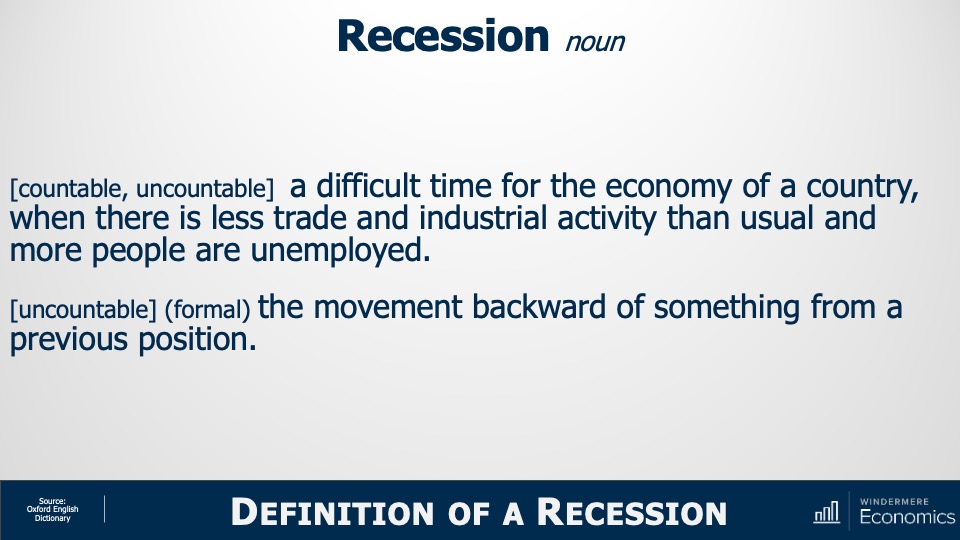
So, what is a recession? To answer this, I will turn to my trusted Oxford English Dictionary, and this is how they describe that word.
Definition of a Recession
Image Source: Matthew Gardner
Recession:
a difficult time for the economy of a country, when there is less trade and industrial activity than usual, and more people are unemployed
the movement backward of something from a previous position
Well, how do we use these definitions when it comes to the ownership housing market?
I guess that “less trade” could mean lower sales and we have certainly seen sales pull back. “Movement backward” could be how someone might describe the fact that sale prices have been pulling back in many markets across the country.
But although some may say that we really are in a housing recession given the definition of the word, is it really accurate? Are we are inextricably headed down a road that leads to the bursting of some sort of bubble as we all remember from 2007? I don’t believe we are. To explain my thinking let’s start out by looking at housing supply.
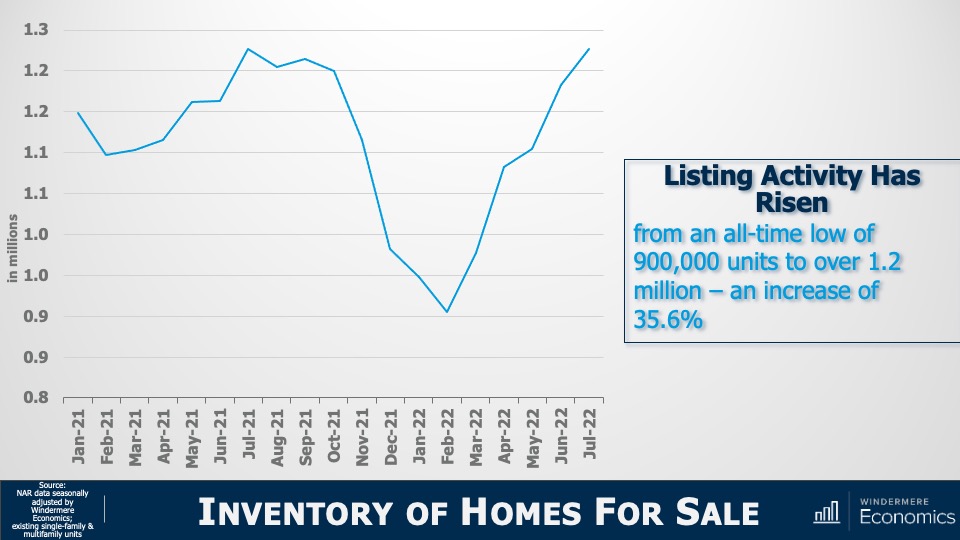
Inventory of Homes for Sale
Image Source: Matthew Gardner
Yes, listing activity is up—can’t argue with that—with the number of resale homes for sale jumping by more than a third from the start of this year. But there’s more to it than that. You see, we have to look a little further back to better understand what’s really going on.
And to do this, let’s check out the number of homes for sale during the first seven months of this year and compare those numbers to the same periods in 2018 through 2021.
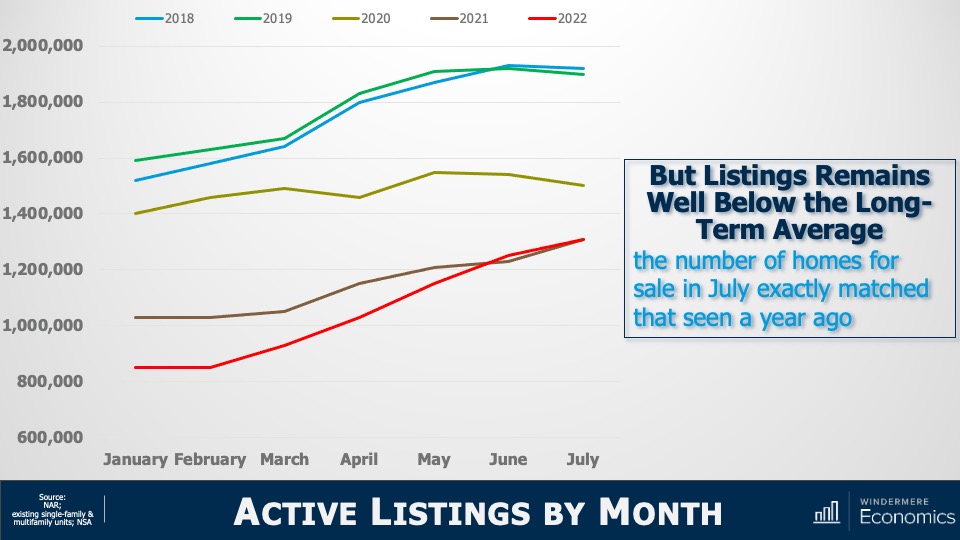
Active Listings By Month
Image Source: Matthew Gardner
I don’t know about you, but this doesn’t look like a chart showing a massively oversupplied market! The number of homes for sale in July of this year was almost exactly the same as we saw last July and is still well below the levels seen in 2018, 2019, or 2020.
Sure, listings are up. But are we at levels that will cause prices to tumble? Remember that it was a massive increase in the number of homes for sale that led to the housing bubble bursting back in 2007. Listings peaked at almost 3.9 million units in 2006; but today there are 2.6 million fewer units on the market than we saw back then. Now that we’ve seen that supply isn’t at concerning levels, let’s look at demand.
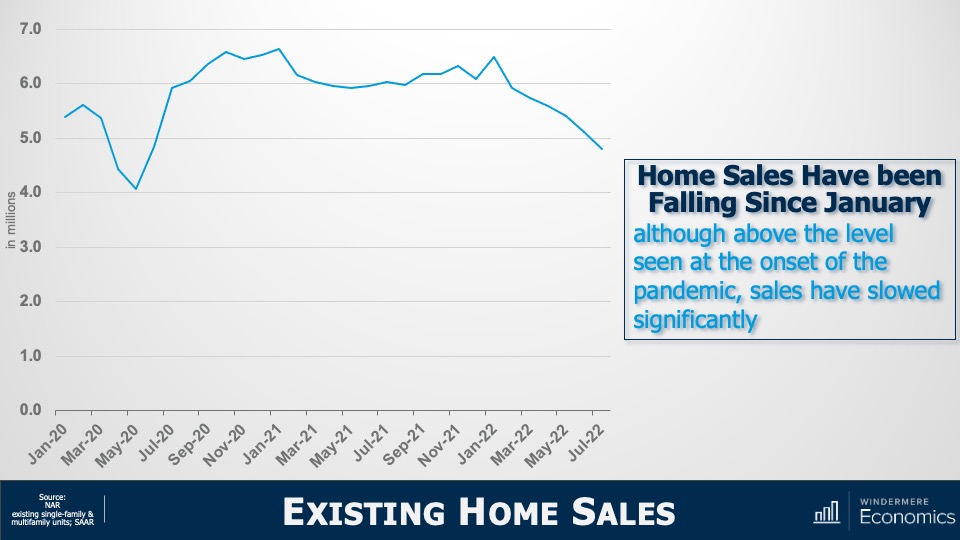
Existing Home Sales
Image Source: Matthew Gardner
This chart doesn’t look too good. On an annualized basis, sales have been pulling back since the start of the year but that’s not the full story. Let’s look at this in a slightly different way.
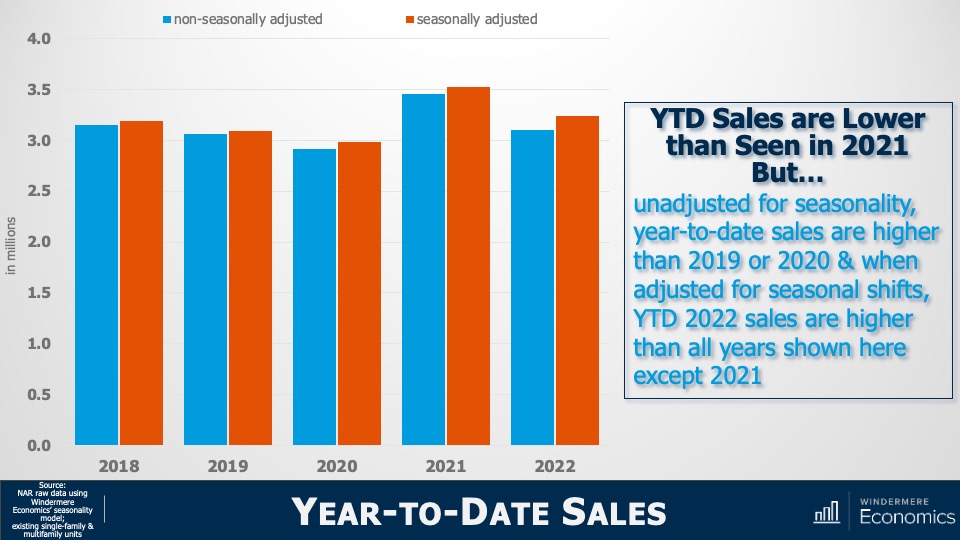
Year-to-Date Sales
Image Source: Matthew Gardner
The bars here show year-to-date sales through July—both adjusted and unadjusted for seasonality—and although unadjusted sales so far this year are lower than we saw during the first seven months of 2021, they are at about the same level as we saw in 2018 and are higher than in 2019 or 2020.
But when we adjust the monthly sales data for seasonality, year-to-date sales in 2022 were higher than all years shown here other than 2021.
So, although sales have fallen, it appears to me that we are heading back to a more realistic market rather than one that is hemorrhaging. Yet another indicator we need to consider when examining the market for evidence of some sort of recession are months of inventory , which shows how long it would take to sell every home for sale using the current monthly sales pace.
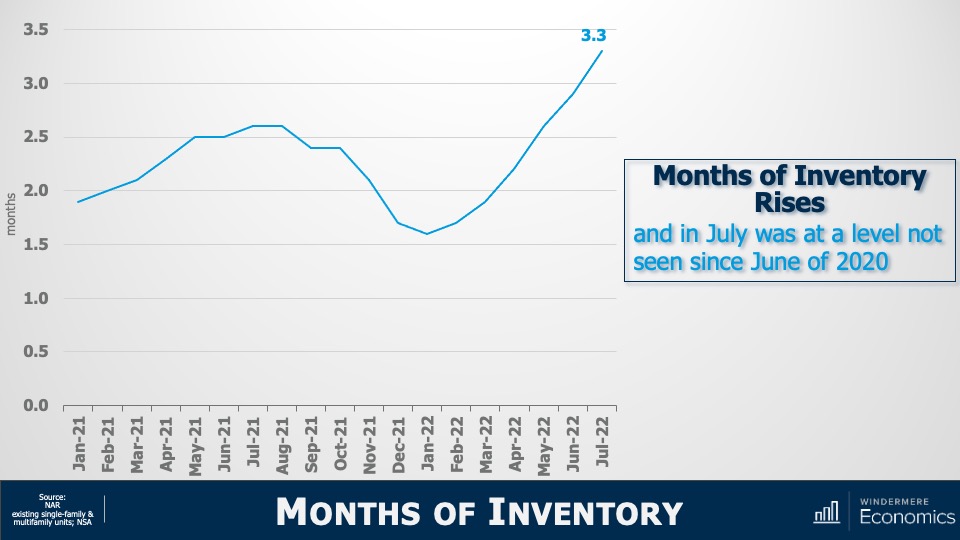
Months of Inventory
Image Source: Matthew Gardner
This graph shows that it would take three months to sell every home on the market given the sales we saw in July. That is quite a jump from the January pace but, again, perspective is everything.
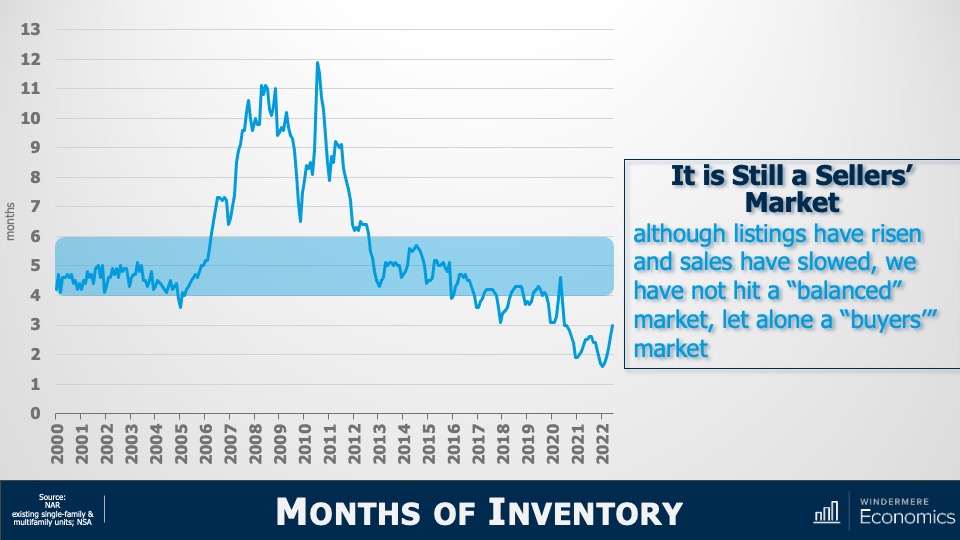
Months of Inventory: Seller’s Market
Image Source: Matthew Gardner
At three months, it is still a seller’s market. It’s generally accepted that the definition of a seller’s market is any number below four months; a balanced market is four to six months of inventory, and a buyer’s market is when the month of inventory is above six.
And a simple bit of math shows us that, for the market to shift from favoring sellers to favoring buyers, the number of homes for sale must break above two million—which we haven’t seen since 2015—and monthly sales would have to drop to below 300,000. We’ve only seen that happen three times in history: November 2008, and again in July and August of 2010.
Yes, listings are up, and sales are down. There’s no denying it. But, again, does the data justify the term recession? My answer would be no. But, if you’re still not convinced, let’s turn our attention to sale prices. I think that might help make things even clearer.
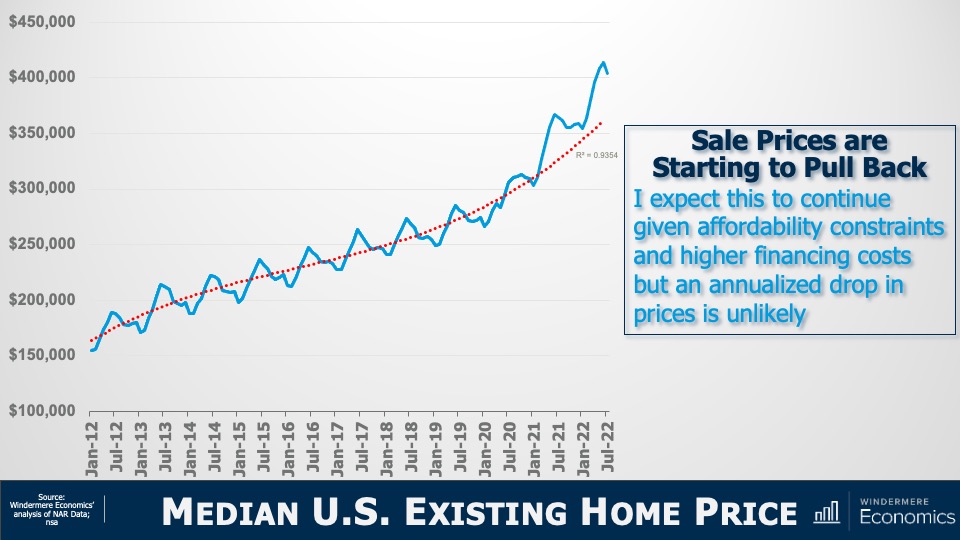
Median U.S. Existing Home Price
Image Source: Matthew Gardner
The solid line represents the median sale prices of homes over time and the dotted line shows the trend. You can clearly see that we started breaking away from the trend line in early 2021 and that’s not at all surprising as it started the month after mortgage rates hit their historic all-time low.
But today’s financing costs are significantly higher, and prices have started to slide. Although I certainly expect that we will see sale prices fall further, it appears to me as if they are simply moving back to the long-term trend, and not collapsing.
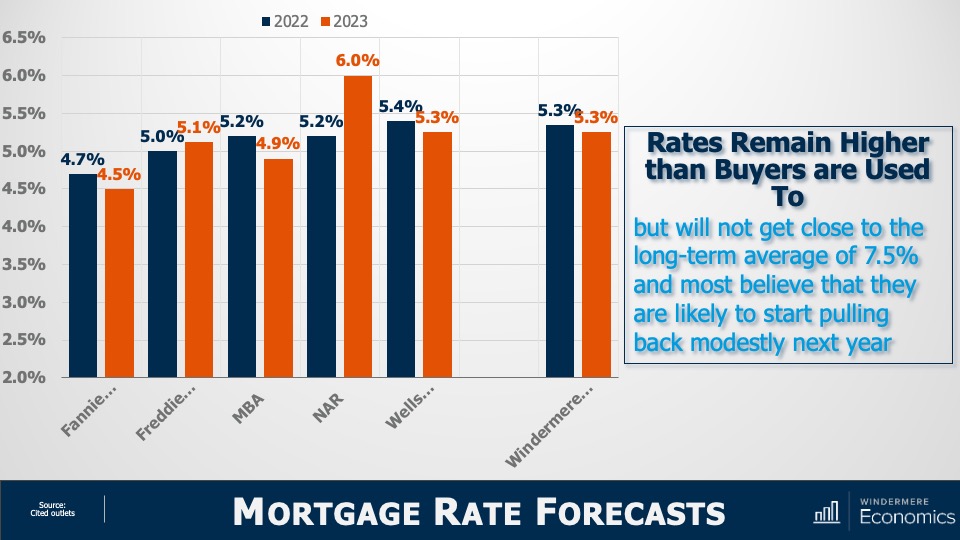
Mortgage Rate Forecasts
Image Source: Matthew Gardner
With mortgage rates doubling from their 2021 lows, downward pressure on sale price was to be expected. But will they—as some think—rise to a level that will cause home prices to plummet? To answer that, here are the forecasts of several associations. You’ll see that all, bar the National Association of Realtors and Freddie Mac, see rates pulling back—albeit modestly—in 2023.
Of course, all these are annual averages and today’s rates are higher with the latest Freddie Mac data showing the average 30-year fixed rate above 6%—a level we haven’t seen since 2008.
However, economists including myself find it unlikely that rates will continue rising significantly from where they are today. The mortgage market is certainly in a bit of disarray right now with the yield curve inverting, but that should correct itself by early next year and that’s why we generally expect rates to start pulling back from their current levels by the start of 2023.
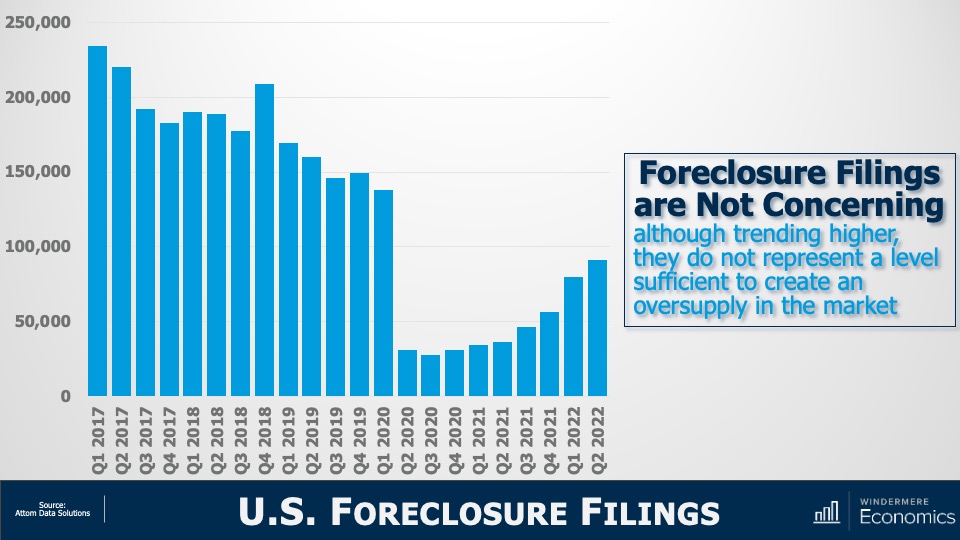
But if rising rates are triggering memories of 2008, you wouldn’t be alone. There are some expecting that the spike in rates will trigger a surge in foreclosures and that will doom the market. But as you see here, although foreclosure filings have certainly risen, they are still remarkably low compared to historic standards.
U.S. Foreclosure Filings
Image Source: Matthew Gardner
In the second quarter, newly delinquent mortgages represented just 1.9% of all mortgages outstanding1 and that’s the lowest share the market has seen since 2006. Although I do expect the number of homes being foreclosed on will rise as we move into 2023, I just don’t see it getting to the levels necessary to materially impact the market. And a big part of the reasoning behind my thinking is this:
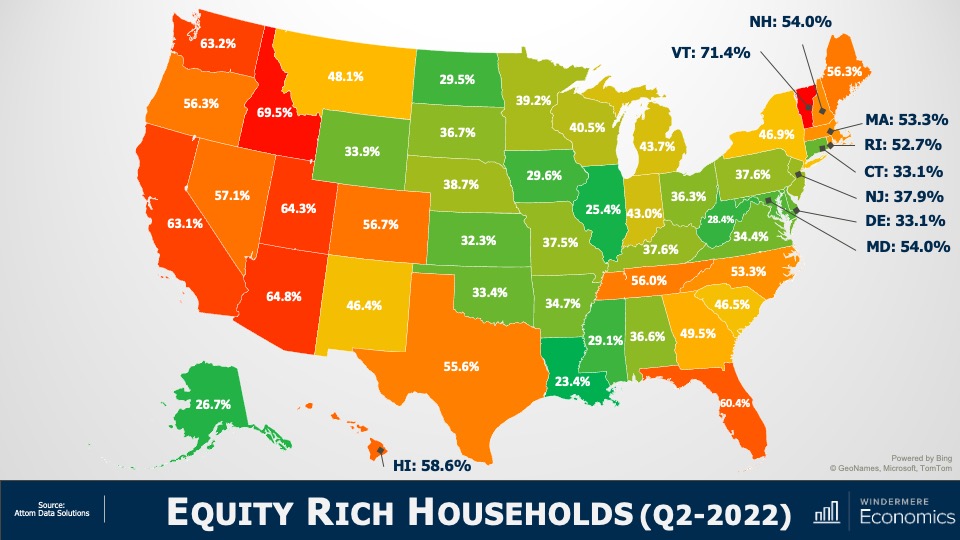
Equity Rich Households (Q2 2022)
Image Source: Matthew Gardner
In the second quarter of 2022, over 48% of homeowners with a mortgage were sitting on more than 50% equity.
Simply put, for enough homeowners to be put in a negative equity situation that would lead them to enter foreclosure and materially damage the market, home prices across the country would have to fall by a percentage greater than we saw during the market crash. And I just don’t see this happening.
The word “recession” has many connotations, and when it’s used to describe the housing market, it can engender a significant level of panic. So, I will ask you all. Given the data I have showed you today, do you think that we are in a housing recession?
Yes, supply levels have risen. But they are still relatively low when compared to historic averages and with builders slowing construction activity to a crawl, it’s unlikely that housing supply will grow much organically. Over the longer term, I believe that the supply of resale homes for sale will remain below historic averages. I say this for one simple reason: mortgage rates.
In 2020, a record number of households refinanced their homes to take advantage of the mortgage rates that had been plummeting. And in 2021, over six million home buyers got mortgages with rates averaging below 3%.
I would suggest to you that we will not see the number of homes for sale even get back to normalized levels in the mid-term, as many potential sellers will decide not to sell, because if they did, they would lose the never seen before and likely never to be seen again mortgage rate that they currently have.
Of course, there will be sellers who have to move because of factors such as job relocation, death, or divorce, but I would contend that listing activity may well be tight for a long time. And if supply remains below the level of demand, the market is further protected.
And as far as demand goes, let’s not forget that the age makeup of the country suggests that we will see a lot more potential buyers as Millennials and Generation Z mature, with current numbers suggesting significant buyer demand for the next two decades.
As for sale prices, I still believe (as do almost all economists) that the median home price next year will be higher than we will see this year, but a very significant drop in the pace of sales growth is likely as we trend down to historic averages.
Of course, all real estate is local and there are markets across the country that will see prices drop in absolute terms. But even in the most highly susceptible markets, it will be a temporary phenomenon. By 2024, homeowners in these markets will see the value of their homes start to rise again.
I’m going to leave you with my quote to describe today’s market today and it’s that we are in a “housing reversion,” NOT a housing recession.
As always, I’d love to hear your comments on my thoughts so feel free to reach out. In the meantime, stay safe out there and I’ll see you all again next month.
1: New York Fed Quarterly Report on Household Debt and Credit
The math of a home sale is relatively straightforward. Sellers list their home at a certain price, a buyer makes an offer, and eventually the two parties reach a final, agreed-upon price. However, between these two points in the selling process, there are several other figures that go into to setting a home’s value that you should be aware of. Your real estate agent will be your best resource in interpreting the different values associated with your home and what they mean as you prepare to sell.
Understanding the Value of Your Home
Listed Price (Asking Price)
Also known as an asking price, the listing price of a home is the price at which a seller lists their property when it goes on the market. The listing price is a gross price, meaning the costs associated with selling the home are not included. A real estate agent’s Comparative Market Analysis (CMA) will accurately set your home’s listing price, accounting for the various factors that influence home prices including location, condition, seasonality, local market conditions, and more.
The listing price is a starting point for negotiations with buyers. You may receive an offer that matches your asking price, but it’s common for buyers to make offers at other price points. You can either accept, reject, or make a counteroffer in response until you and the buyer reach an agreement.
Whether you’re selling in a buyer’s market or a seller’s market may determine you and your agent’s approach to the listing price of your home. There may be certain pricing tactics you can employ to either drive buyer attention or increase competition, but if your home’s listing price strays too far from its market value (see below), it could stay on the market for longer than you expected.
Market Value
As a seller, you’re interested in what buyers are willing to pay for your home. By taking into account a home’s condition, size, curb appeal, and features, as well as local market conditions and what comparable homes are selling for, a home’s market value reflects the price buyers will pay for a property.
A home’s appraised value is determined by a professional appraiser to ensure that the lender is loaning the correct amount of money for the home. Appraisers assess the home’s layout and features, square footage, gross living area (GLA), overall condition inside and out, home updates and remodels, and more. If the appraised value comes in too low or too high, the buyer and seller must renegotiate for the deal to go through. In competitive markets, buyers may include an appraisal gap guarantee in their offer, which states that the buyer will cover the difference between the price of the home and the appraised value.
Sale Price (Purchase Price)
Also known as the purchase price, your home’s sale price is what it ultimately ends up selling for. Once you and the buyer have reached an agreement on the terms of the transaction, the buyer will have the home inspected and final negotiations may occur based on the findings of the inspection. Familiarize yourself with the Common Real Estate Contingencies buyers may include in their offer and what they mean when selling your home.
Net Proceeds
So, how much do you actually make on the sale of your home? After subtracting the total costs of selling from your home’s sale price, you’ll arrive at your net proceeds. This is the amount you walk away with from the transaction.
Assessed Value
Your agent’s CMA is a reliable method of determining your home’s value for its eventual sale, but its assessed value is used for taxation purposes. Employed by local municipal or county entities, an assessor will conduct a review of your property to determine its assessed value. The assessor’s findings are passed to local tax officials, who use that number to calculate the home’s property taxes.
The following analysis of select counties of the Western Washington real estate market is provided by Windermere Real Estate Chief Economist Matthew Gardner. We hope that this information may assist you with making better-informed real estate decisions. For further information about the housing market in your area, please don’t hesitate to contact me.
Regional Economic Overview
The most recent employment data (from May) showed that all but 2,800 of the jobs lost during the pandemic have been recovered. More than eight of the counties contained in this report show employment levels higher than they were before COVID-19 hit. The regional unemployment rate fell to 4.5% from 5.2% in March, with total unemployment back to pre-pandemic levels. For the time being, the local economy appears to be in pretty good shape. Though some are suggesting we are about to enter a recession, I am not seeing it in the numbers given rising employment and solid income growth.
Western Washington Home Sales
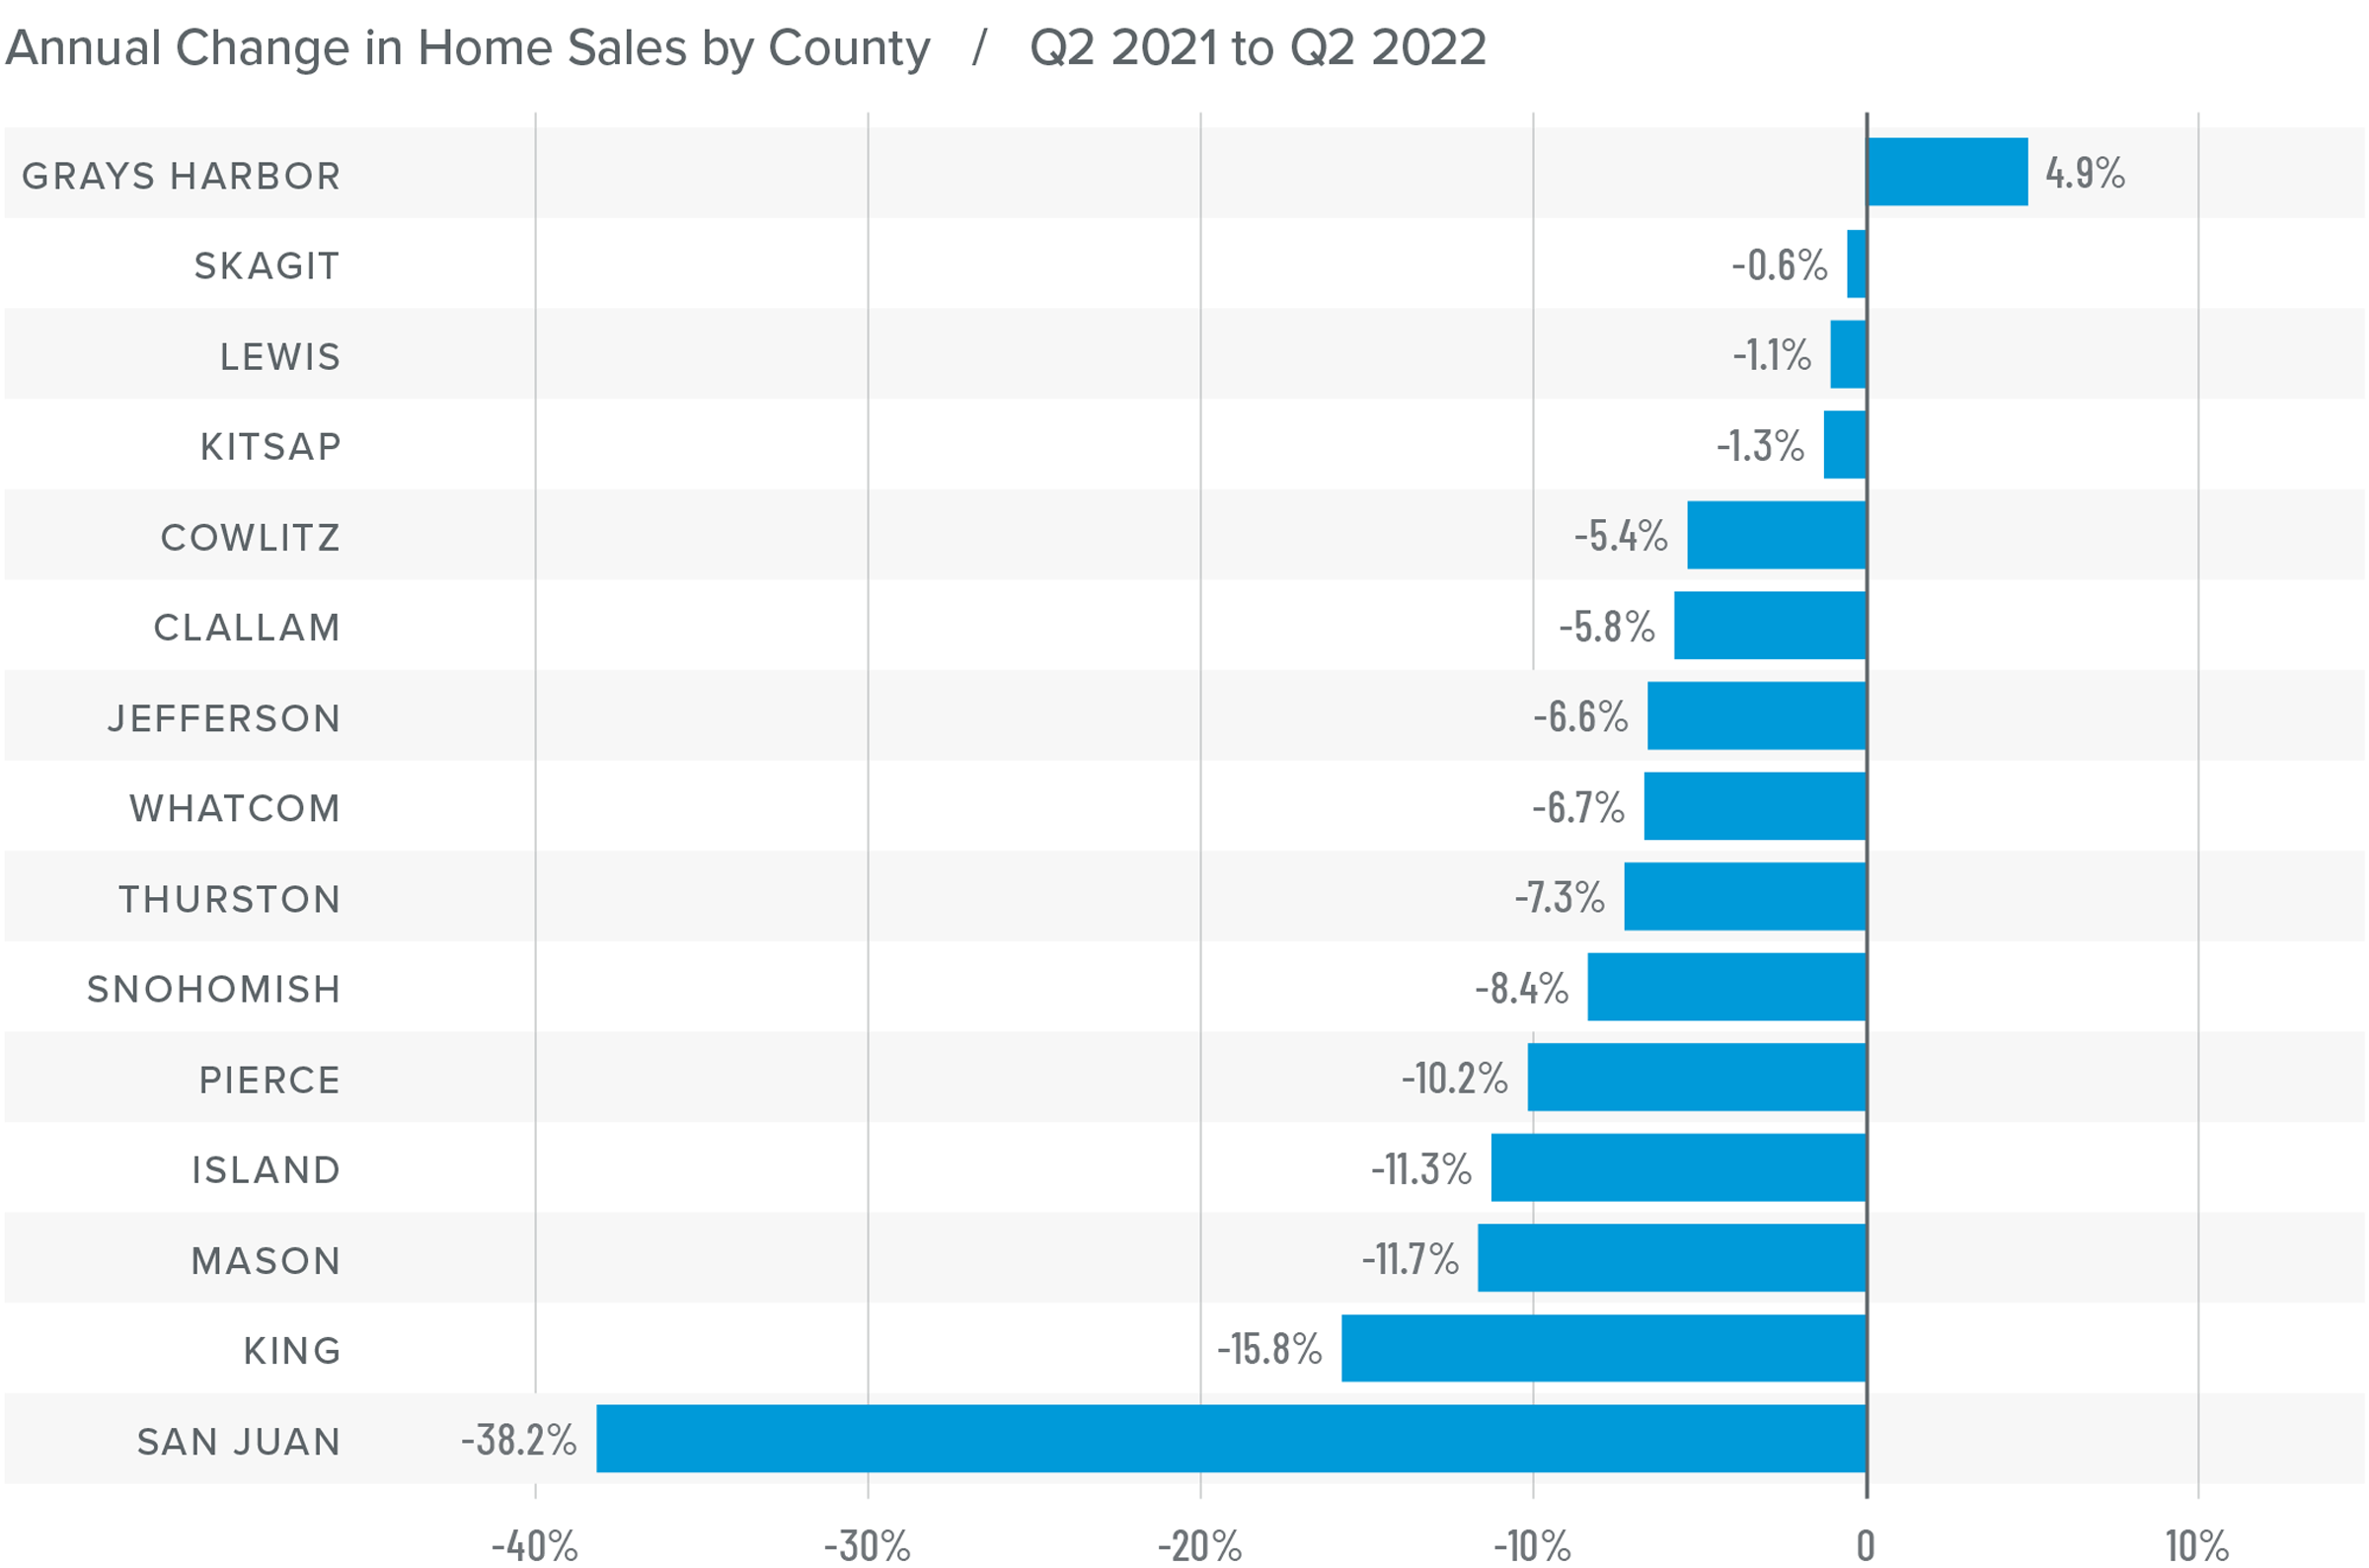
❱ In the second quarter of 2022, 23,005 homes sold, representing a drop of 11% from the same period a year ago, but up by a significant 52% from the first quarter of this year.
❱ Sales rose in Grays Harbor County compared to a year ago but fell across the balance of the region. The spring market, however, was very robust, likely due to growing inventory levels and buyers trying to get ahead of rising mortgage rates.
❱ Second quarter growth in listing activity was palpable: 175% more homes were listed than during the first quarter and 61.98% more than a year ago.
❱ Pending sales outpaced listings by a factor of 3:1. This is down from the prior year but only because of the additional supply that came to market.
Western Washington Home Prices
❱ Even in the face of rising mortgage rates, home prices continue to rise at a well-above-average pace, with average prices up 13.3% year over year to $830,941.
❱ I have been watching list prices as they are a leading indicator of the health of the housing market. Thus far, despite rising mortgage rates and inventory levels, sellers remain confident. This is reflected in rising median list prices in all but three counties compared to the previous quarter. They were lower in San Juan, Island, and Jefferson counties.
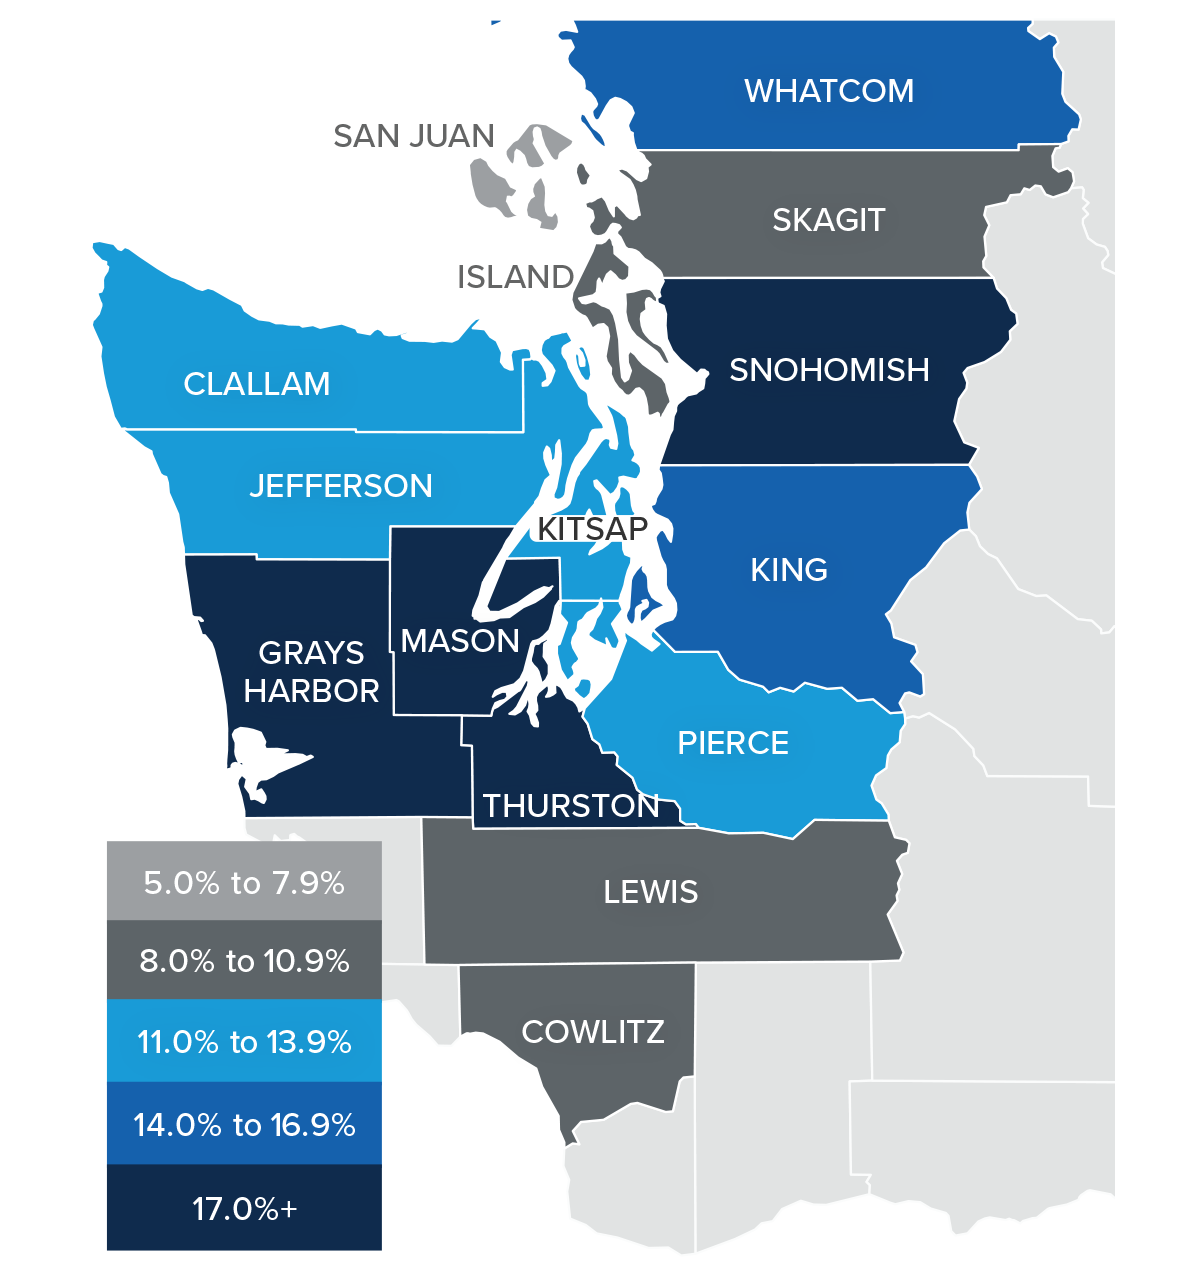
❱ Prices rose by double digits in all but four counties. Snohomish, Grays Harbor, Mason, and Thurston counties saw significant growth.
❱ List prices and supply are both trending higher, but this has yet to slow price growth significantly. I believe we will see the pace of appreciation start to slow, but not yet.
Mortgage Rates
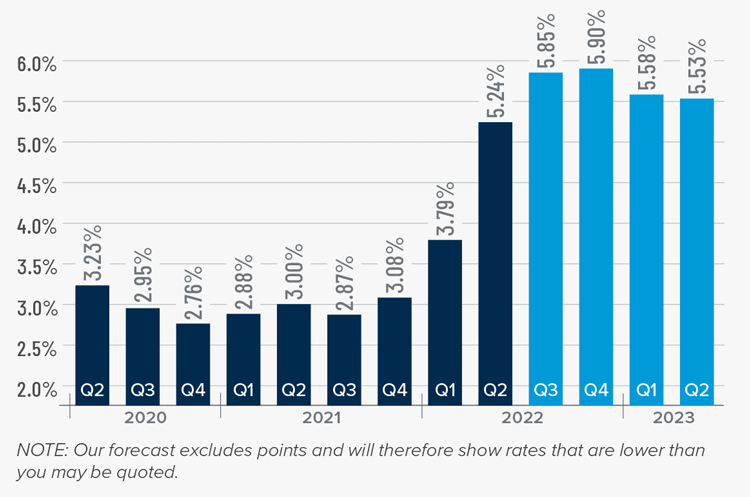
Although mortgage rates did drop in June, the quarterly trend was still moving higher. Inflation—the bane of bonds and, therefore, mortgage rates—has yet to slow, which is putting upward pressure on financing costs.
That said, there are some signs that inflation is starting to soften and if this starts to show in upcoming Consumer Price Index numbers then rates will likely find a ceiling. I am hopeful this will be the case at some point in the third quarter, which is reflected in my forecast.
Western Washington Days on Market
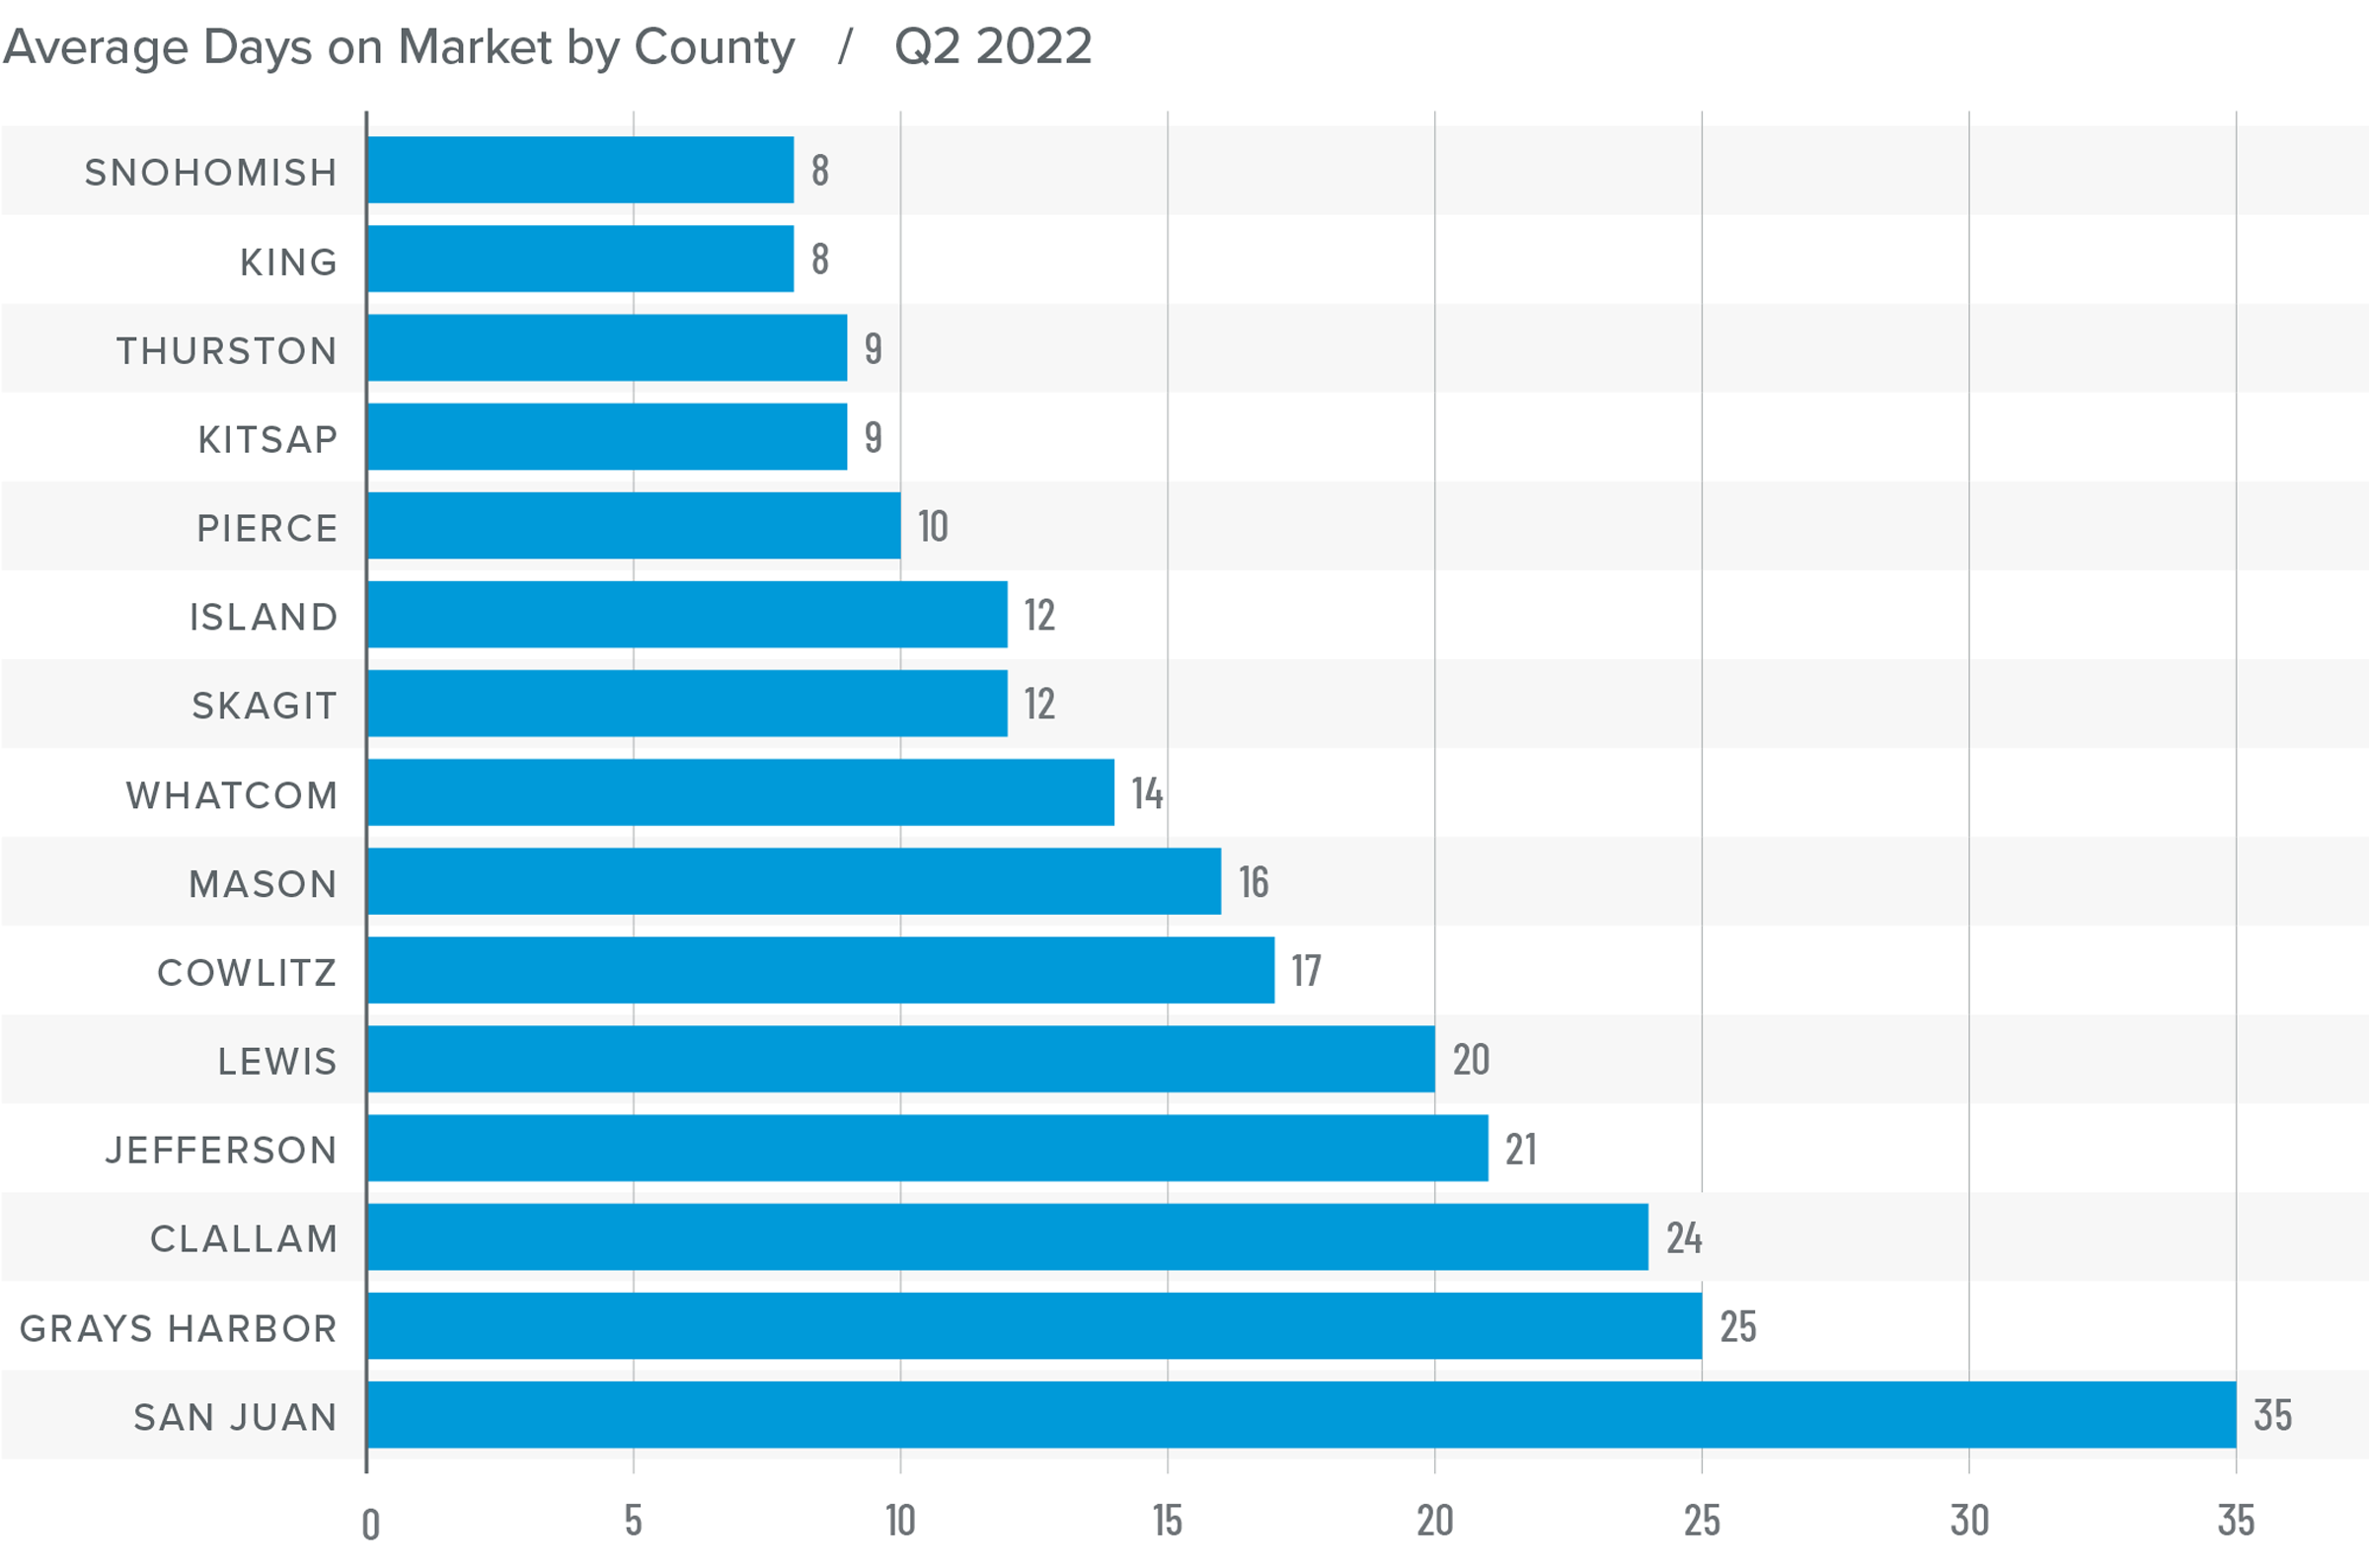
❱ It took an average of 16 days for a home to go pending in the second quarter of the year. This was 2 fewer days than in the same quarter of 2021, and 9 fewer days than in the first quarter.
❱ Snohomish, King, and Pierce counties were, again, the tightest markets in Western Washington, with homes taking an average of between 8 and 10 days to sell. Compared to a year ago, average market time dropped the most in San Juan County, where it took 26 fewer days for a seller to find a buyer.
❱ All but six counties saw average time on market drop from the same period a year ago. The markets where it took longer to sell a home saw the length of time increase only marginally.
❱ Compared to the first quarter of this year, average market time fell across the board. Demand remains very strong.
Conclusions
This speedometer reflects the state of the region’s real estate market using housing inventory, price gains, home sales, interest rates, and larger economic factors.
The economy remains buoyant, which is an important factor when it comes to the regional housing market, particularly as it affects buyers. Even though the number of homes that came to market has jumped significantly, which should favor those looking for a new home, demand is still robust, and the market remains competitive.
Much to the disappointment of buyers, rising listing prices suggest that sellers are clearly still confident even as financing costs continue to increase. While the pace of price growth is slowing, sellers are still generally in control. As such, I have moved the needle a little more in the direction of sellers. Until we see list-price growth and home sales slow significantly, we will not reach a balanced market.

 Facebook
 X
X
 Pinterest
 Copy Link